IMAGE

Fig 6

ID
ZDB-IMAGE-191230-1246
Genes
Antibodies
Source
Figures for Serrano et al., 2019
Image
Figure Caption

Fig 6 Notch signaling is hyperactive in <italic>kmt2d</italic> mutant endothelium/endocardium.

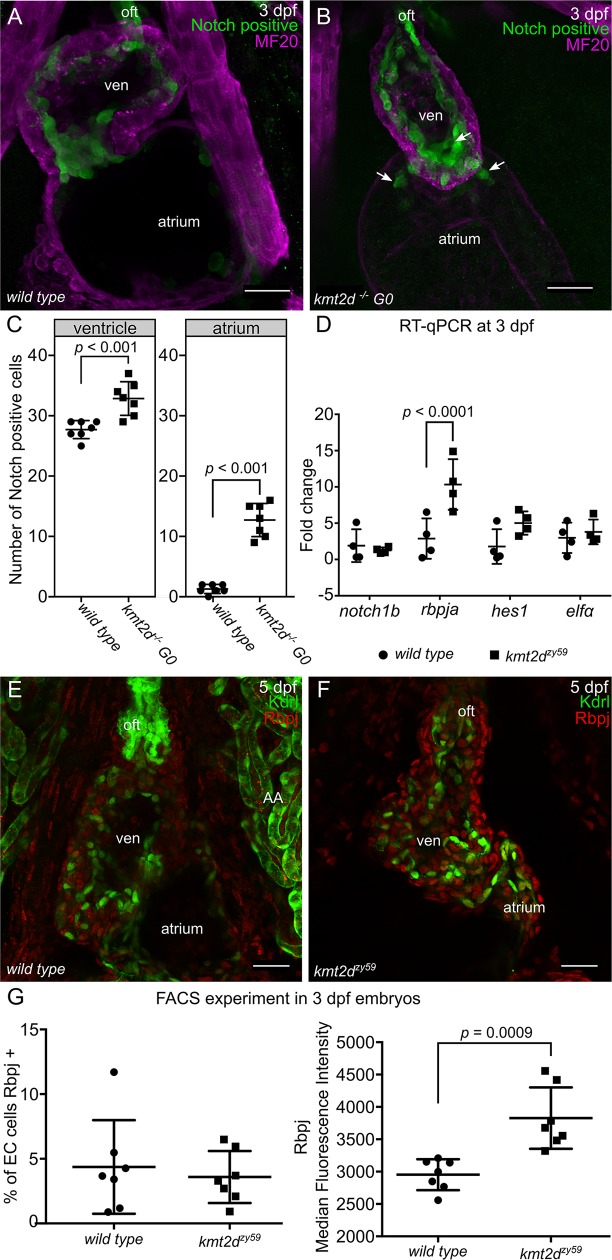
(A-B) Confocal images of the heart of wild-type noninjected control tg(tp1:EGFP)um14 embryo (A) and F0 kmt2d mosaic mutants tg(tp1:EGFP)um14 embryo injected with CRISPR/Cas9 targeting kmt2d (B). F0 kmt2d mosaic mutants injected embryos showed hypoplastic heart as seen in kmt2dzy59 null mutants (B). Notch positive cells (green) were mostly distributed in the atrio-ventricular valve of a 3 dpf embryonic heart. Some endocardial cells in the ventricle and outflow tract were also observed (A). In F0 kmt2d mosaic mutants, hearts showed a significant increase in the number of Notch positive cells in both ventricle and atrium. Ventral view of the heart, only middle sections of the whole data set are shown. Scale bar = 25 μm. (C) Quantification of the amount of Notch positive cells in ventricle and atrium of control and injected embryos. N = 7 per group, unpaired two-tailed t test, p = 0.0001 in ventricle t = 4.95, dF = 36, atrium p = 0.0001, t = 10.99, dF = 36. Values for each data point can be found in S1 Data. (D) RT-qPCR analysis of wild-type sibling control embryos and kmt2dzy59 mutants for some components of the Notch signaling pathway. The Notch transcription factor rbpja was significantly up-regulated kmt2dzy59 embryos, corroborating the results obtained in the F0 kmt2d mosaic mutant analysis. There were no significant differences found for notch1b and hes1. N = 4 per genotype with 2 technical replicates per gene and per genotype assessed; elfα was use as control gene. Ct values were normalized using α-tubulin as gene of reference; fold change of relative expression was calculated using the ΔΔCt method. Multiple t test p < 0.0001 for rbpja, t = 6.04, dF = 24. Values for each data point can be found in S1 Data. (E–F) Confocal images of wild-type sibling control embryos (E) and kmt2dzy59 mutants (F) showing Rbpj protein expression levels and patterning at 5 dpf. Ventral view of the heart, only MIP of half data set is shown. Scale bar = 25 μm. (G) Summarized data and statistics from FACS experiment performed in 14 individual samples (7 wild-type siblings and 7 kmt2d mutants). Wild-type tg(kdrl:GFP) siblings (A) and kmt2dzy59;tg(kdrl:GFP) mutants were collected at 3 dpf, were processed for IF, were digested, and were prepared for FACS. Unpaired two-tailed t test, % of EC cells Rbpj positives p = 0.63, n.s. t = 0.49, dF = 12; Rbpj MFI p = 0,0009, t = 4.35, df = 12. Values for each data point can be found in S1 Data. Altogether our results show that Notch pathway is hyperactivated in endocardial cells of kmt2dzy59 mutants and demonstrate that this increased Notch activity is consequence of up-regulated Notch pathway transcription factor Rbpj specifically in EC cells. To our knowledge, these results provide the first evidence of a regulatory link between Kmt2d and Notch signaling during developmental processes in vertebrates. Ct, cycle threshold; ΔΔCt, delta-delta cycle thrshold; dpf, days post fertilization; EC, endocardial cells; F0, filial 0; FACS, fluorescent activated cell sorting; G0, generation 0; IF, immunofluorescense; MIP, maximum intensity projection; oft, out flow tract; RT-qPCR, reverse transcription-quantitative polymerase chain reaction; ven, ventricle.

Figure Data
Acknowledgments
This image is the copyrighted work of the attributed author or publisher, and ZFIN has permission only to display this image to its users. Additional permissions should be obtained from the applicable author or publisher of the image. Full text @ PLoS Biol.