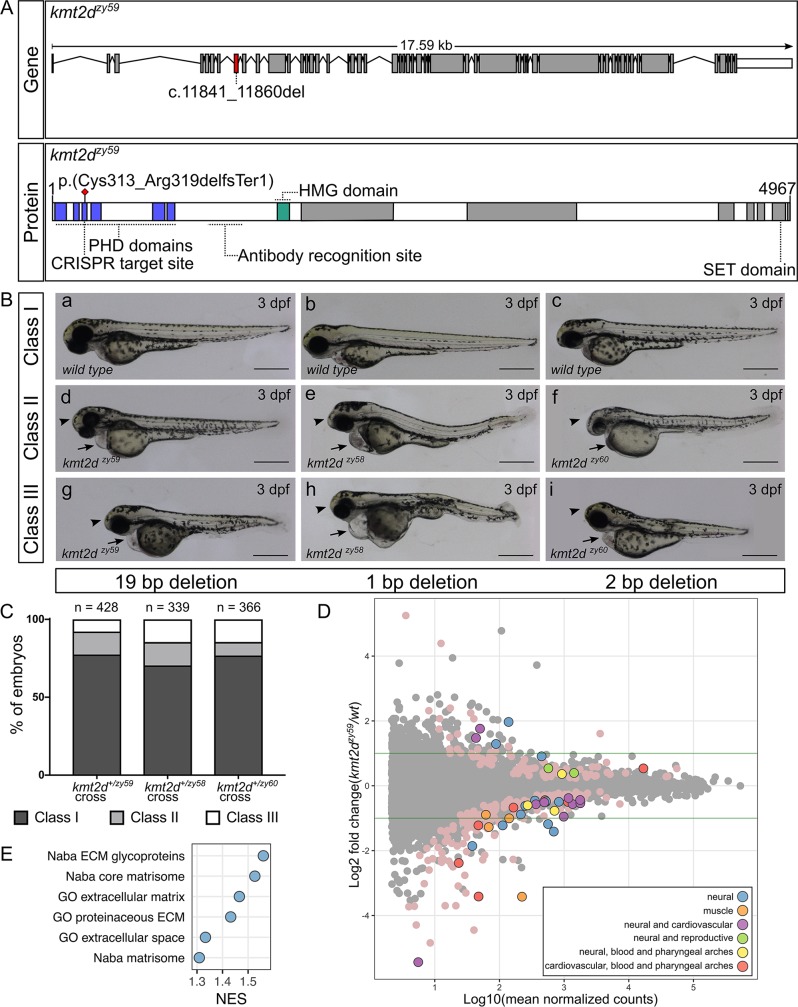
IMAGE

Fig 1

ID
ZDB-IMAGE-191230-44
Source
Figures for Serrano et al., 2019
Image
Figure Caption

Fig 1 Generation and transcriptome profiling of <italic>kmt2d</italic> zebrafish mutants.

(A) Schematic of zebrafish kmt2d gene showing the 19 bp deletion allele (zy59) and its predicted amino acid change in the protein. The gRNA was designed to target exon 8 (red shaded exon) at the 5ʹ end of the gene. The resulting 19 bp deletion is predicted to cause an early stop codon at the level of the PHD tandem domains (blue) located at the N terminus of the protein. The anti-Kmt2d antibody epitope is located after the PHD domains and before the HMG domain (green), allowing the validation of the early stop in kmt2dzy59 zebrafish null mutant. (B) Lateral views of zebrafish wild-type sibling embryos (a–c) and kmt2d mutants for 3 different alleles: kmt2dzy59 (a, d, g), kmt2dzy58 (b, e, h), and kmt2dzy60 (c, f, i) at 3 dpf. All 3 alleles shared the same phenotypic characteristics: microcephaly (arrowhead), heart edema (arrow), and mild to moderate body axis defects. Variable expressivity was observed in all the analyzed mutant alleles (Classes I to III). Scale bar = 500 μm. (C) Variable expressivity was analyzed in 3 different embryo clutches resulting from a heterozygous by heterozygous cross for each mutant allele. Embryos were ranked in 3 different classes based on the severity of the phenotype. Class I, wild-type and heterozygous siblings with no phenotype; class II, mutants with microcephaly and heart edema; class III, mutants with microcephaly, heart edema, and shorten body axes. Percentages of different clutches were calculated per the total number of living embryos for each genotype. Chi-square test (p = 0.14) and binomial test (p = 0.09) were performed to assess mendelian ratios considering heterozygous embryos within the Class I category. There was no significant discrepancy between obtained and expected percentages of embryo phenotype. Values for each data point can be found in S1 Data. (D) MA plot of differentially expressed genes from RNA-seq of individual kmt2dzy59 mutants (n = 6) versus wild-type (n = 6) sibling embryos at 1 dpf. The log10 of mean normalized counts are plotted against the log2 fold changes for each gene tested. Green horizontal lines represent 2-fold change differences. Negative log2 fold changes represent genes with reduced expression in the mutants relative to wild type. Both light pink points (no outline) and color-coded points (with outline) represent significantly differentially expressed genes (FDR adjusted p < 0.05). The top 50 genes (ranked by FDR adjusted p-value) were classified into 6 categories based on expression data, bibliography, phenotype information, and gene ontology (S1 Table). Raw data used for this analysis can be found in the following repository: https://b2b.hci.utah.edu/gnomex/gnomexFlex.jsp?requestNumber=475R. (E) GSEA. Analysis was performed by converting zebrafish gene names to human gene names using genes with a one-to-one ortholog relationship retrieved from Ensembl Compara database. The number of resulting genes identifiers analyzed was 9,128 out of 33,737 (Genome build Zv9, Ensembl annotation released version 79). Adjusted p-values were calculated per category. NES of gene sets with a FDR of 5% are plotted to summarized GSEA results. dpf, days post fertilization; ECM, extracellular matrix; FDR,; GO, gene ontology; GSEA, gene set enrichment analysis; HMG, High Mobility Group domain; Kmt2d, Histone-Lysine N-Methyltransferase 2D; NES, Normalized Enrichment Score; PHD, Plant Homeo Domain; RNA-seq, RNA sequencing; SET: Su-Enhancer-of-zeste and Trithorax domain.

Figure Data
Acknowledgments
This image is the copyrighted work of the attributed author or publisher, and ZFIN has permission only to display this image to its users. Additional permissions should be obtained from the applicable author or publisher of the image. Full text @ PLoS Biol.