IMAGE

Fig 5

ID
ZDB-IMAGE-191230-1245
Source
Figures for Serrano et al., 2019
Image
Figure Caption

Fig 5 <italic>kmt2d</italic><sup><italic>zy59</italic></sup> mutants fail to develop AA3 to AA6.

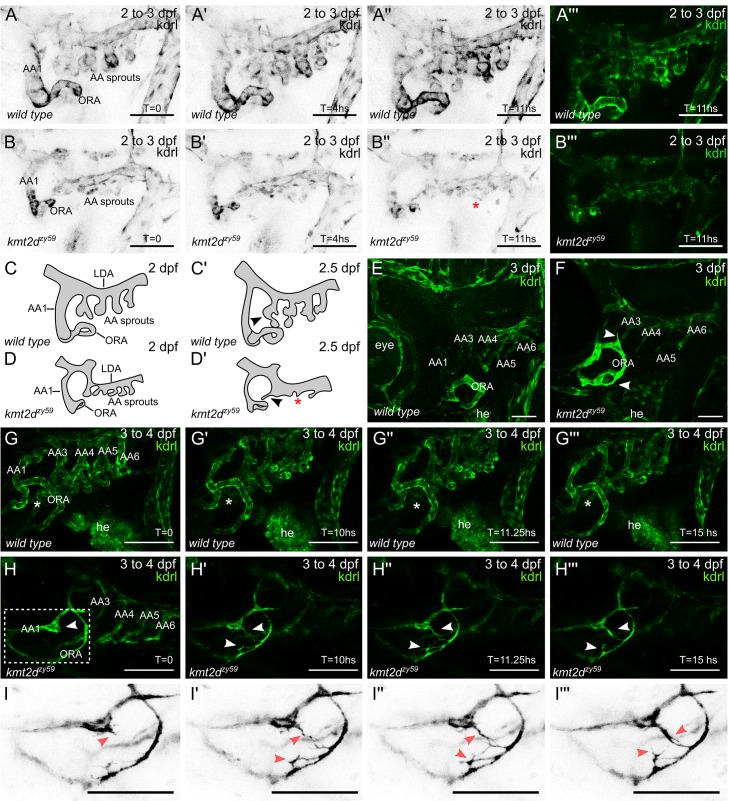
(A–B) Still images (MIP) from time-lapse live imaging performed from 2 dpf to 3 dpf. Cranial-lateral view at the level of AA development from wild-type sibling (A–A‴, S3 Video) and kmt2dzy59 mutant (B–B‴, S4 Video). Images were selected at the 0, 4, and 11 hour time points. Images were converted to grayscale and inverted for better visualization (A–A", B–B"). A‴ and B‴ show A" and B" without grayscale processing. Red asterisk (B") denotes abnormal vascular development of AA sprouts at the level of the ventral border of LDA. (scale bars = 50 μm). (C-D) Schematic cartoons highlighting the development of AA in wild-type embryos (C, Cʹ) and kmt2dzy59 mutants (D, Dʹ). C corresponds to A, Cʹ correspond to A", D corresponds to B and Dʹ to B". Red asterisk indicates ectopic AA sprouting. (E–F) Cranial-lateral view of vasculature in wild-type tg(kdrl:GFP) sibling (A) and kmt2dzy59;tg(kdrl:GFP) mutants at 3 dpf. After time-lapse experiment (A, B), embryos were released from agarose and processed for IF and confocal imaging. Wild-type embryos showed correct patterning and secondary sprouting of AA3 to AA6 (E). At 3 dpf, kmt2dzy59 mutants had abnormal development of primary sprouts of AA3 to AA6, which are thinner and atrophic. In contrast, AA1 and ORA were thicker and exhibit abnormal morphogenesis and endothelial cell protrusions (F, white arrowhead; scale bars = 25 μm). (G-I) Still images (MIP) from time-lapse live imaging performed from 3 dpf to 4 dpf. Cranial-lateral view at the level of AA development from wild-type sibling and kmt2dzy59 mutant. Images were selected at the 0, 10, 11.25, and 15 hour time points. Asterisks (G–G‴) denote normal vascular development in the area between AA1 and ORA. No blood vessel forms in this area in wild-type background. Arrowheads (H–H‴, I–I‴) indicate endothelial cells extending multiple filopodia and forming a new and ectopic blood vessel. White dashed rectangle (H) specifies zoomed area in (I). Images were set on grayscale and the look-up table was inverted for better contrast of tip cell-like endothelial cells in kmt2dzy59 mutant (I–I‴; scale bars = 100 μm). AA, aortic arch; AA1, mandibular arch; AA2, hyoid arch; AA3, first branchial arch; AA4, second branchial arch; AA5, third branchial arch; AA6, fourth branchial arch; dpf, days post fertilization; he, heart; hpf, hours post fertilization; kdrl, kinase insert domain receptor like; LDA, lateral ventral aorta; MIP, maximum intensity projection; ORA, opercular artery.

Figure Data
Acknowledgments
This image is the copyrighted work of the attributed author or publisher, and ZFIN has permission only to display this image to its users. Additional permissions should be obtained from the applicable author or publisher of the image. Full text @ PLoS Biol.