IMAGE

Fig 8

ID
ZDB-IMAGE-191230-1248
Genes
Source
Figures for Serrano et al., 2019
Image
Figure Caption

Fig 8 Pharmacological inhibition of Notch signaling reestablishes normal Rbpj protein levels in kmt2d mutant endothelial and endocardial cells.

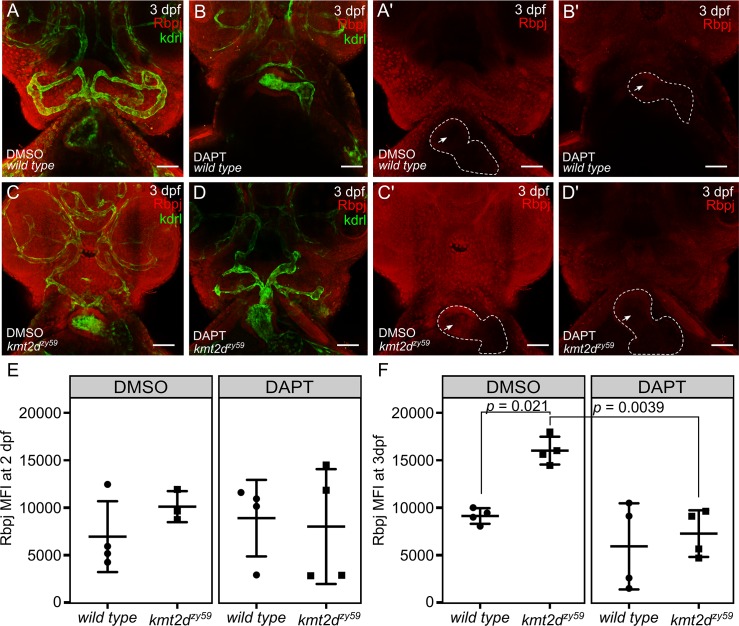
(A–D) Confocal images of wild-type sibling (A, B) and kmt2dzy59 mutant (C, D) embryos at 3 dpf. Cephalic ventral views. DMSO as solvent control (A, C) and DAPT for Notch signaling inhibition (B, D) were applied to embryos of indicated genotypes. Rbpj protein levels (Red channel) are higher in DMSO-kmt2dzy59 mutants (C, Cʹ). Arrow in Aʹ–Dʹ is indicating endocardial Rbpj expression—note higher endocardial Rbpj levels in Cʹ. DAPT treatment restored Rbpj signal levels in kmt2dzy59 embryos (D, Dʹ) as a consequence of Notch signaling inhibition. Dashed line in Aʹ–Dʹ indicates heart outline. Red, Rbpj; green, GFP (to enhance endocardial/endothelial Kdrl:GFP transgenic label). (E-F) Summarized data and statistics from FACS experiments performed in 16 individual samples per time point (4 DMSO wild-type siblings and 4 DMSO kmt2d mutants; 4 DAPT wild-type siblings and 4 DAPT kmt2d mutants per time point). Wild-type tg(kdrl:GFP) siblings (A) and kmt2dzy59;tg(kdrl:GFP) mutants from each treatment (DMSO or DAPT) were collected at 2 dpf (E) and 3 dpf (F), processed for IF, digested, and prepared for FACS. Two-way ANOVA multiple comparison test adjusted p-values per each condition at 2 dpf as follow: DMSO:wild-type versus DMSO:kmt2dzy59: p = 0.7762, DMSO:wild type versus DAPT:wild type: p = 0.9179, DMSO:wild type versus DAPT:kmt2dzy59: p = 0.9849, DMSO:kmt2dzy59versus DAPT:wild type: p = 0.9823, DMSO:kmt2dzy59versus DAPT:kmt2dzy59: p = 0.9186, DAPT:wild type versus DAPT:kmt2dzy59: p = 0.9910. Two-way ANOVA multiple comparison test adjusted p-values per each condition at 3 dpf as follow: DMSO:wild type versus DMSO:kmt2dzy59: p = 0.0221 (significant *), DMSO:wild type versus DAPT:wild type: p = 0.5394, DMSO:wild type versus DAPT:kmt2dzy59: p = 0.9263 (no significant difference, DAPT rescue was to similar control wild type values), DMSO:kmt2dzy59versus DAPT:wild type: p = 0.0012, DMSO:kmt2dzy59versus DAPT:kmt2dzy59: p = 0.0039 (significant *, DAPT rescues kmt2d mutant Rbpj levels), DAPT:wild type versus DAPT:kmt2dzy59: p = 0.9839. ANOVA summary results: Interaction F (1, 12) = 4.173, p = 0.0637; Treatment F (1, 12) = 19.37, p = 0.0009, Genotype F (1, 12) = 9.202, p = 0.0104. Values for each data point can be found in S1 Data. dpf, days post fertilization; FACS, fluorescent activated cell sorting; GFP, green fluorescent protein; kdrl, kinase insert domain receptor like.

Figure Data
Acknowledgments
This image is the copyrighted work of the attributed author or publisher, and ZFIN has permission only to display this image to its users. Additional permissions should be obtained from the applicable author or publisher of the image. Full text @ PLoS Biol.