
- Title
-
Evolutionary Differences in the Vegf/Vegfr Code Reveal Organotypic Roles for the Endothelial Cell Receptor Kdr in Developmental Lymphangiogenesis
- Authors
- Vogrin, A.J., Bower, N.I., Gunzburg, M.J., Roufail, S., Okuda, K.S., Paterson, S., Headey, S.J., Stacker, S.A., Hogan, B.M., Achen, M.G.
- Source
- Full text @ Cell Rep.
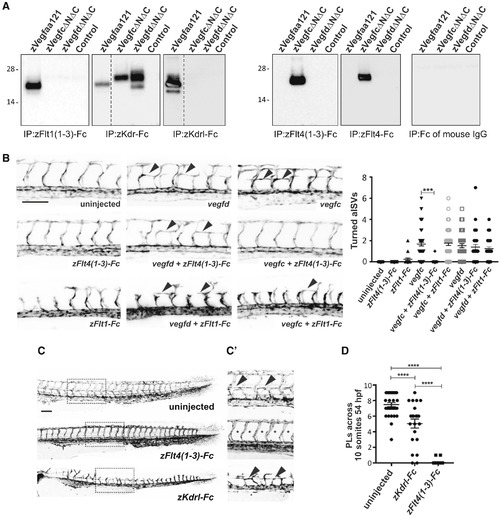
Interactions of Zebrafish Vegf Ligands with Receptors (A) Analysis of ligand binding by receptor pull-down. zVegfaa121-FLAG (zVegfaa121), zVegfcΔNΔC-FLAG (zVegfcΔNΔC), and zVegfdΔNΔC-FLAG (zVegfdΔNΔC) were precipitated from conditioned media of transiently transfected HEK293T cells using zFlt1(1-3)-Fc, zKdr-Fc, zKdrl-Fc, zFlt4-Fc, zFlt4(1-3)-Fc, and the Fc domain of mouse IgG. Conditioned media of HEK293T cells transiently transfected with expression vector lacking DNA encoding Vegf ligands was negative control (Control). Ligands were detected by anti-FLAG western blotting (reducing conditions). Input levels of ligands and receptors in all precipitations were controlled as described in the STAR Methods, and all blots were conducted in parallel. Molecular weight markers (in kDa) are indicated on the left, and dotted lines indicate where images were spliced to remove irrelevant tracks. Expected sizes for subunits of these Vegf family ligands are 20–26 kDa. All precipitations and western blots were conducted at least three times using fresh media, with results similar to those shown here. (B) Confocal micrographs of 30-hpf Tg(fli1a:EGFP) zebrafish embryos showing formation of arterial intersegmental vessels (aISVs) in uninjected control and turning of aISVs (arrowheads) following injection of vegfc or vegfd mRNA. The turning of aISVs following injection of vegfc, but not vegfd, mRNA is rescued by co-injection of mRNA for zFlt4(1-3)-Fc. In contrast, co-injection of mRNA for zFlt1-Fc does not rescue the turning of aISVs induced by either vegfc or vegfd mRNA. Quantitation of turned aISVs in response to injection of different mRNAs is shown in the graph (n = 33 embryos for all study groups; ∗∗∗p < 0.0001). (C) Confocal micrographs of 54-hpf Tg(fli1a:EGFP) zebrafish embryos showing the development of parachordal LECs (PLs) in uninjected controls and embryos injected with mRNA for zFlt4(1-3)-Fc or zKdrl-Fc. The regions in dotted rectangles are shown at higher magnification in (C′) with arrowheads highlighting PLs in uninjected embryos and those injected with mRNA for zKdrl-Fc, and asterisks indicating where PLs are absent in embryos injected with mRNA for zFlt4(1-3)-Fc. Scale bars in (B) and (C) represent 100 μm and apply to all images. (D) Quantification of PLs reveals a significant reduction following injection of mRNA for zFlt4(1-3)-Fc (n = 37 embryos) or zKdrl-Fc (n = 28) compared to uninjected controls (n = 32). ∗∗∗∗p < 0.0001. Data are represented as the mean ± SEM. |
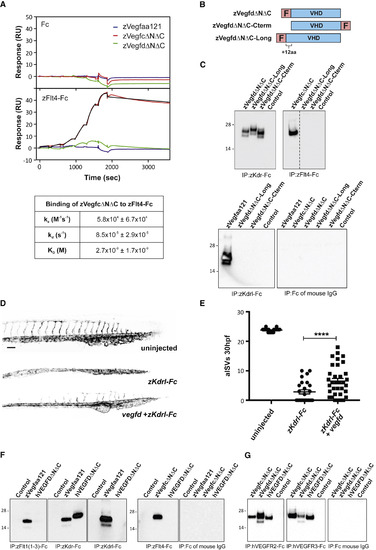
Interactions of Zebrafish Vegfd with Receptors, and Cross-Species Ligand-Receptor Interactions (A) Analysis of ligand interactions with zFlt4-Fc by surface plasmon resonance. zVegfdΔNΔC-FLAG (green line), zVegfaa121-FLAG (blue), and zVegfcΔNΔC-FLAG (red) were injected in a 3-fold increasing concentration series from 4.1 to 1000 nM across captured control Fc (top graph) and captured zFlt4-Fc (bottom graph). Black line denotes fit to a 1:1 model for binding of zVegfcΔNΔC-FLAG to zFlt4-Fc. Kinetic parameters of zVegfcΔNΔC-FLAG binding to zFlt4-Fc are shown in the table. Values are means and standard deviations of fits to the 1:1 binding model, for three independent experiments. (B) Schematic maps of alternative forms of mature zebrafish Vegfd: zVegfdΔNΔC-FLAG (zVegfdΔNΔC), VegfdΔNΔC-FLAG-Cterm (VegfdΔNΔC-Cterm), and zVegfdΔNΔC-Long-FLAG (zVegfdΔNΔC-Long). zVegfdΔNΔC-Long-FLAG has 12 extra residues at the N terminus of the VHD compared to other constructs. F denotes FLAG. (C) Analysis of receptor binding by alternative forms of mature zebrafish Vegfd. Ligands were precipitated from conditioned media of transfected HEK293T cells using receptor-Fc constructs indicated under each blot. Conditioned media of cells transfected with expression vector lacking DNA for ligands was negative control (Control). Ligands were detected by anti-FLAG western blotting (reducing conditions). Input levels of ligands and receptors in all precipitations were controlled as described in the STAR Methods, and all blots were conducted in parallel. Molecular weight markers (kDa) are indicated and expected sizes for ligand subunits are 20–26 kDa. Dotted line indicates where image was spliced to remove irrelevant track. (D and E) At 30 hpf, embryos injected with mRNA for zKdrl-Fc have fewer arterial intersegmental vessels (aISVs) than uninjected embryos, which can be partially rescued by co-injection of vegfd mRNA (D), quantified in (E) (n = 32 embryos for uninjected, n = 25 for zKdrl-Fc, and n = 34 for zKdrl-Fc + Vegfd; ∗∗∗∗p < 0.0001). Scale bar in (D) represents 100 μm and applies to all images. (F) Binding of human VEGFD to zebrafish receptors. Human VEGFDΔNΔC (hVEGFDΔNΔC) was precipitated with constructs indicated under blots and detected by anti-FLAG western blotting. Input levels of ligands and receptors in all precipitations were controlled as described in the STAR Methods, and all blots were conducted in parallel. Media from cells transfected with expression vector lacking ligand DNA was negative control (Control), and zVegfaa121-FLAG (zVegfaa121) and zVegfcΔNΔC-FLAG (zVegfcΔNΔC) were positive controls. Expected sizes for ligand subunits are 20–26 kDa. (G) Binding of zebrafish Vegfd to human receptors. zVegfdΔNΔC-FLAG (zVegfdΔNΔC) was precipitated using human VEGFR2-Fc (hVEGFR2-Fc), human VEGFR3-Fc (hVEGFR3-Fc), or Fc of mouse IgG, and detected by western blotting. Input levels of ligands and receptors in all precipitations were controlled as described in the STAR Methods, and all blots were conducted in parallel. Negative control (Control) was as for (F), and hVEGFDΔNΔC and zVegfcΔNΔC were positive controls. Molecular weight markers (kDa) are indicated. All precipitations and western blots in (C), (F), and (G) were conducted at least three times using fresh media, with results similar to those shown here. Data are represented as the mean ± SEM. |
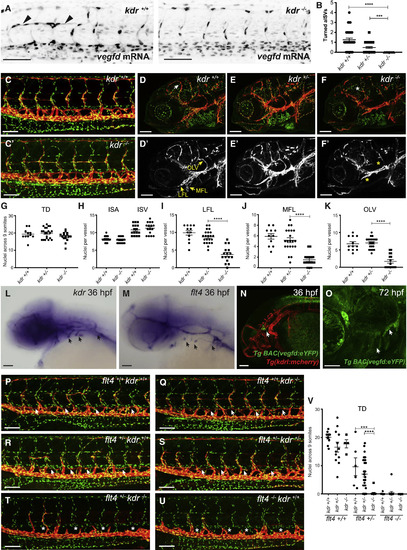
Kdr Interacts with zVegfd In Vivo and Regulates Craniofacial Lymphangiogenesis but Not Development of the Thoracic Duct (A) Confocal images of 30-hpf Tg(fli1a:nEGFP) embryos injected with vegfdmRNA showing turned aISVs (arrowheads) in wild-type but not in kdrhomozygous mutant siblings. (B) Quantification of turned aISVs in wild-type (n = 39), kdruq38bh heterozygous (n = 42), and homozygous mutant (n = 15) embryos at 30 hpf. (C and C′) Analysis of thoracic duct (TD) development. Confocal images of 5-dpf Tg(fli1a:nEGFP);Tg(−5.2lyve1b:dsRed) transgenic embryos produced by in-crossing kdruq38bh carriers. TD development in kdruq38bh mutant embryos (C′) is equivalent to wild-type (C) siblings. Red denotes Lyve1-positive lymphatics and green denotes Fli1-positive nuclei. (D–F) Analysis of facial lymphatic development. Images showing the facial region of 5-dpf Tg(fli1a:nEGFP);Tg(−5.2lyve1b:dsRed) transgenic embryos. Genotypes in (D) and (D′) are kdr+/+, (E) and (E′) kdr+/−, and (F) and (F′) kdr−/−. Red denotes Lyve1-positive lymphatics and green denotes Fli1-positive nuclei. White arrow indicates mural LEC loop and white asterisk denotes its absence. (D′–F′) lyve1b:dsRed only; white anatomical structures are Lyve1-positive lymphatics. Yellow arrows indicate normal lateral facial lymphatics (LFLs), medial facial lymphatics (MFLs), and otolithic facial lymphatics (OLVs). Yellow asterisks indicate where there are reductions in LEC numbers in these vessels. (G) There was no significant difference in the number of nuclei in the TD when homozygous kdruq38bh mutants were compared to heterozygous and wild-type siblings (kdr+/+ embryos n = 11; kdr+/− n = 21; kdr−/− n = 16). (H) There was no significant difference in the number of nuclei in ISAs or ISVs when homozygous kdruq38bh mutants were compared to wild-type siblings (n = 16, 2 ISAs or ISVs from 8 embryos). (I–K) Significant differences in LFL (I), MFL (J), and OLV (K) LEC numbers were observed when homozygous kdruq38bh mutant embryos (n = 16) were compared to kdruq38bh heterozygous (n = 22) or wild-type (n = 12) embryos. ∗∗∗∗p < 0.0001. (L and M) In situ hybridization using probes complementary to kdr (L) and flt4(M) in 36-hpf embryos reveals robust expression in the region where lymphatic sprouts emerged from the common cardinal vein and the primary head sinus (arrows). (N and O) Confocal images of the TgBAC(vegfd:eYFP)uq42bh; Tg(kdrl:mcherry)transgenic line at 36 hpf (N) and TgBAC(vegfd:eYFP)uq42bh at 72 hpf (O) reveal expression of vegfd in the craniofacial region close to where lymphatic sprouts emerge from the primary head sinus (arrows). (P–U) Confocal images of 5-dpf Tg(fli1a:nEGFP);Tg(−5.2lyve1b:dsRed) transgenic embryos produced by in-crossing kdruq38bh/flt4hu4602 carriers. Genotypes in (P) are flt4+/+ kdr+/+, (Q) flt4+/+ kdr−/−, (R) flt4+/− kdr+/+, (S) flt4+/− kdr+/−, (T) flt4+/− kdr−/−, and (U) flt4−/− kdr+/+. In flt4hu4602 heterozygous embryos, loss of kdruq38bhresulted in a complete failure of the TD to form (T) and were phenotypically indistinguishable from flt4hu4602 mutant embryos. Arrows indicate TD and asterisks its absence. (V) Quantification of TD nuclei for embryos referred to in (P)–(U) (flt4+/+/kdr+/+embryos n = 11; flt4+/+/kdr+/− n = 12; flt4+/+/kdr−/− n = 4; flt4+/−/kdr+/+ n = 6; flt4+/−/kdr+/− n = 31; flt4+/−/kdr−/− n = 16; flt4−/−/kdr+/+ n = 8; flt4−/−/kdr+/− n = 14; flt4−/−/kdr−/− n = 8). All scale bars in this figure represent 100 μm except for (O), in which the bar denotes 50 μm. Data are represented as the mean ± SEM. EXPRESSION / LABELING:
PHENOTYPE:
|
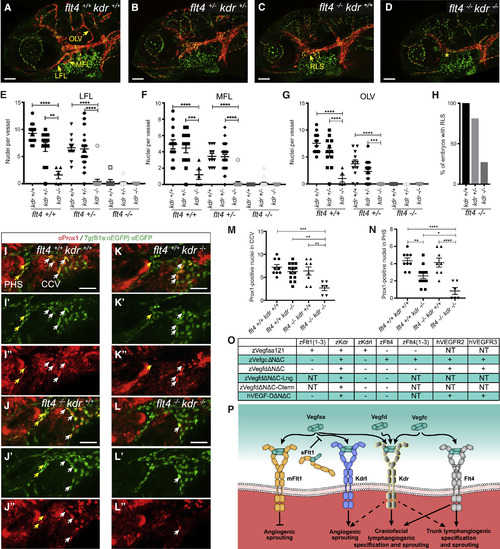
Functional Relationship of Flt4 and Kdr In Vivo, and Summation of Ligand-Receptor Interactions (A–D) Confocal images showing facial region of 5-dpf Tg(fli1a:nEGFP);Tg(−5.2lyve1b:dsRed) transgenic embryos produced by in-crossing kdruq38bh/flt4hu4602 carriers. Genotypes in (A) are flt4+/+ kdr+/+, (B) flt4+/−kdr+/−, (C) flt−/− kdr+/+, and (D) flt4−/− kdr−/−. In (C) and (D), arrow indicates rostral lymph sac (RLS) and asterisk indicates its absence. All scale bars in (A)–(D) represent 100 μm. (E–G) Quantification of nuclei in lateral (LFL; E), medial (MFL; F), and otolithic (OLV; G) facial lymphatics in kdruq38bh and flt4hu4602 mutant combinations (flt4+/+/kdr+/+ embryos n = 14; flt4+/+/kdr+/− n = 13; flt4+/+/kdr−/− n = 5; flt4+/−/kdr+/+ n = 11; flt4+/−/kdr+/− n = 30; flt4+/−/kdr−/− n = 17; flt4−/−/kdr+/+ n = 8; flt4−/−/kdr+/− n = 19; flt4−/−/kdr−/− n = 10). (H) Quantification of RLS formation in flt4hu4602 mutant background reveals kdruq38bh mutants form fewer RLSs than kdr wild-type or heterozygotes (flt4−/−/kdr+/+ embryos n = 8; flt4−/−/kdr+/− n = 19; flt4−/−/kdr−/− n = 10). (I–L) Confocal images of 36-hpf Tg(fli1a:nEGFP) transgenic embryos, produced by in-crossing kdruq38bh/flt4hu4602 carriers, and immunostaining for Prox1. Merged images; green denotes EGFP-tagged Fli1-positive nuclei and red denotes Prox1. (I′)–(L′) EGFP-tagged Fli1-positive nuclei only, and (I″)–(L″) show Prox1 only. Yellow arrows indicate Prox1/EGFP-positive nuclei in primary head sinus (PHS); white arrows indicate common cardinal vein (CCV). Genotypes in (I) are flt4+/+ kdr+/+, (J) flt4−/− kdr+/+, (K) flt4+/+ kdr−/−, and (L) flt4−/− kdr−/−. All scale bars in (I)–(L) represent 50 μm and apply to all images. (M and N) Quantification in CCV (M) and PHS (N) reveals fewer Prox1-positive nuclei in kdruq38bh/flt4hu4602 double mutants (n = 6 embryos), compared to wild-type (n = 9), flt4hu4602 (n = 8), or kdruq38bh (n = 14) mutants. ∗p < 0.05, ∗∗p < 0.01, ∗∗∗p < 0.001, and ∗∗∗∗p < 0.0001. (O) Table of Vegf ligand-receptor interactions based on pull-down experiments. NT denotes not tested. (P) Schematic showing binding of zebrafish Vegf ligands to receptors, and downstream events. Mechanisms of organotypic lymphangiogenesis in the craniofacial region and trunk are indicated. mFlt1 denotes full-length transmembrane Flt1; sFlt1 soluble form; dashed arrows compensatory roles toward downstream event. Data are represented as the mean ± SEM. EXPRESSION / LABELING:
PHENOTYPE:
|
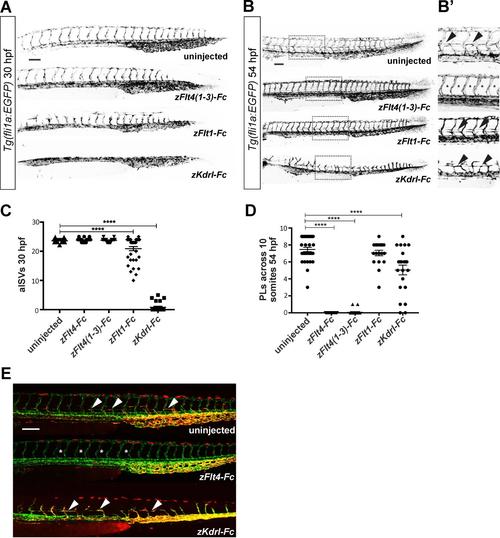
Analysis of primary and secondary sprouting in zebrafish embryos, Related to Figure 2 and STAR Methods. (A) Confocal micrographs of 30-hpf Tg(fli1a:EGFP) zebrafish embryos showing development of arterial intersegmental vessels (aISVs) in uninjected controls and embryos injected with mRNAs for soluble receptor constructs. Note the clearly abnormal vascular patterning in the embryos injected with mRNA for zFlt1-Fc and zKdrl-Fc. (B and B’) Confocal micrographs of 54-hpf Tg(fli1a:EGFP) zebrafish embryos showing development of parachordal LECs (PLs). Regions in the spotted rectangles are shown at higher magnification in B’ with arrowheads highlighting PLs, which are absent in embryos injected with mRNA for zFlt4(1-3)-Fc (asterisks). (C) Quantification of aISVs revealed a significant reduction following injection of mRNA for zFlt1-Fc (n=37 embryos) or zKdrl-Fc (n=28) compared to controls (n=46) (zFlt4-Fc n=47; zFlt4(1-3)-Fc n=27). **** denotes P<0.0001. (D) Quantification of PLs shows a reduction following injection of mRNA for zFlt4(1-3)-Fc, zFlt4-Fc or zKdrl-Fc compared to control (n=36, 29, 21 and 31, respectively; n=20 for zFlt1-Fc embryos). **** denotes P<0.0001. (E) Confocal micrographs of 54- hpf Tg(fli1a:nEGFP),Tg(-5.2lyve1b:dsRed) embryos showing PLs in uninjected controls (arrowheads), which are absent (asterisks) following injection of mRNA for zFlt4(1-3)-Fc, but present following injection of mRNA for zKdrl-Fc. Scale bars in A, B and E represent 100 m and apply to all images. |
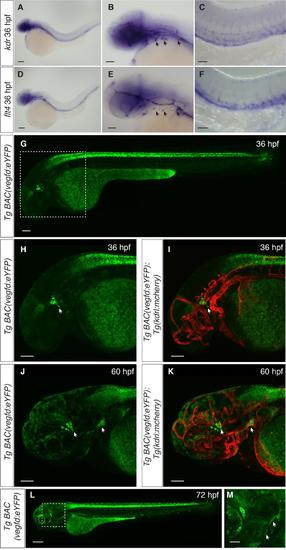
In situ hybridisation for kdr and flt4, and analysis of vegfd expression, Related to Figure 4. (A-F) In situ hybridisation using probes designed to kdr (A-C) and flt4 (D-F) showing expression in the craniofacial region as well as in the posterior cardinal vein. (G-M) Expression of vegfd visualised using the TgBAC(vegfd:eYFP)uq42bh transgenic line. (G-I) At 36 hpf, expression is observed in the craniofacial region close to where lymphatic sprouts emerge from the primary head sinus (arrows). (J,K) At 60 hpf, vegfd expression is observed in the region close to where the otolithic lymphatic sprout emerges and in the region where mural LECs sprout from the choroidal vascular plexus (arrows). (L,M) At 72 hpf continued expression of vegfd can be observed in the craniofacial region where the first lymphatic sprouts form and in branchial arches where lymphatics sprouts emerge (arrows). Scale bars in A, D and L represent 200 m, in B, C and E-K 100 m and in M 50 m. EXPRESSION / LABELING:
|
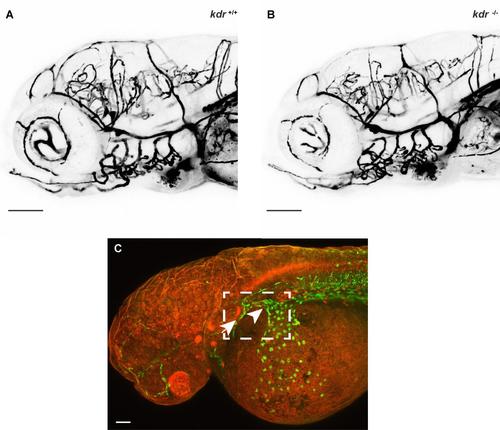
Microangiography shows no difference in cranial blood vessels in kdr mutants compared to wild-type siblings, Related to Figure 5. (A,B) Microangiography using 2000 kDa dextran fluorescein was used to detect blood vessel defects, however there were no obvious defects in blood vessel patterning at 5 dpf (n=4 mutant, n=6 wild-type sibling). (C) Confocal image of 36-hpf Tg(fli1a:nEGFP) transgenic embryo showing the region (boxed), containing the primary head sinus (arrow) and common cardinal vein (arrowhead), imaged in Figure 5I-L. Scale bars in A and B represent 100 m and in C 50 m. |