
Fig. 2
- ID
- ZDB-FIG-190919-7
- Publication
- Vogrin et al., 2019 - Evolutionary Differences in the Vegf/Vegfr Code Reveal Organotypic Roles for the Endothelial Cell Receptor Kdr in Developmental Lymphangiogenesis
- Other Figures
- All Figure Page
- Back to All Figure Page
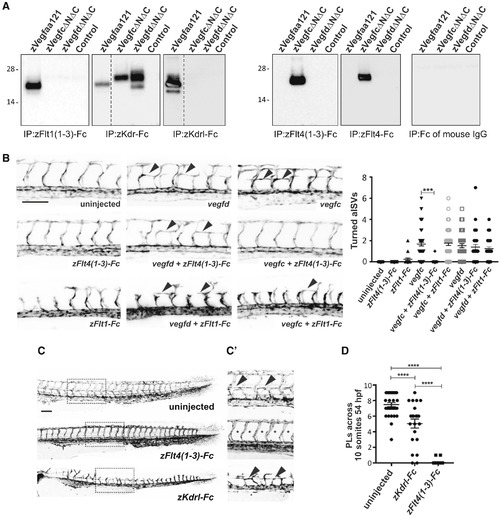
Interactions of Zebrafish Vegf Ligands with Receptors (A) Analysis of ligand binding by receptor pull-down. zVegfaa121-FLAG (zVegfaa121), zVegfcΔNΔC-FLAG (zVegfcΔNΔC), and zVegfdΔNΔC-FLAG (zVegfdΔNΔC) were precipitated from conditioned media of transiently transfected HEK293T cells using zFlt1(1-3)-Fc, zKdr-Fc, zKdrl-Fc, zFlt4-Fc, zFlt4(1-3)-Fc, and the Fc domain of mouse IgG. Conditioned media of HEK293T cells transiently transfected with expression vector lacking DNA encoding Vegf ligands was negative control (Control). Ligands were detected by anti-FLAG western blotting (reducing conditions). Input levels of ligands and receptors in all precipitations were controlled as described in the STAR Methods, and all blots were conducted in parallel. Molecular weight markers (in kDa) are indicated on the left, and dotted lines indicate where images were spliced to remove irrelevant tracks. Expected sizes for subunits of these Vegf family ligands are 20–26 kDa. All precipitations and western blots were conducted at least three times using fresh media, with results similar to those shown here. (B) Confocal micrographs of 30-hpf Tg(fli1a:EGFP) zebrafish embryos showing formation of arterial intersegmental vessels (aISVs) in uninjected control and turning of aISVs (arrowheads) following injection of vegfc or vegfd mRNA. The turning of aISVs following injection of vegfc, but not vegfd, mRNA is rescued by co-injection of mRNA for zFlt4(1-3)-Fc. In contrast, co-injection of mRNA for zFlt1-Fc does not rescue the turning of aISVs induced by either vegfc or vegfd mRNA. Quantitation of turned aISVs in response to injection of different mRNAs is shown in the graph (n = 33 embryos for all study groups; ∗∗∗p < 0.0001). (C) Confocal micrographs of 54-hpf Tg(fli1a:EGFP) zebrafish embryos showing the development of parachordal LECs (PLs) in uninjected controls and embryos injected with mRNA for zFlt4(1-3)-Fc or zKdrl-Fc. The regions in dotted rectangles are shown at higher magnification in (C′) with arrowheads highlighting PLs in uninjected embryos and those injected with mRNA for zKdrl-Fc, and asterisks indicating where PLs are absent in embryos injected with mRNA for zFlt4(1-3)-Fc. Scale bars in (B) and (C) represent 100 μm and apply to all images. (D) Quantification of PLs reveals a significant reduction following injection of mRNA for zFlt4(1-3)-Fc (n = 37 embryos) or zKdrl-Fc (n = 28) compared to uninjected controls (n = 32). ∗∗∗∗p < 0.0001. Data are represented as the mean ± SEM. |