
Fig. 3
- ID
- ZDB-FIG-190919-6
- Publication
- Vogrin et al., 2019 - Evolutionary Differences in the Vegf/Vegfr Code Reveal Organotypic Roles for the Endothelial Cell Receptor Kdr in Developmental Lymphangiogenesis
- Other Figures
- All Figure Page
- Back to All Figure Page
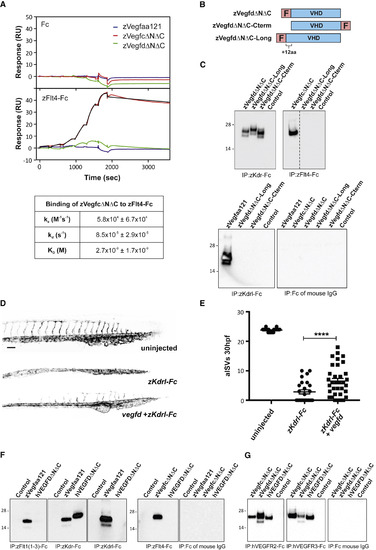
Interactions of Zebrafish Vegfd with Receptors, and Cross-Species Ligand-Receptor Interactions (A) Analysis of ligand interactions with zFlt4-Fc by surface plasmon resonance. zVegfdΔNΔC-FLAG (green line), zVegfaa121-FLAG (blue), and zVegfcΔNΔC-FLAG (red) were injected in a 3-fold increasing concentration series from 4.1 to 1000 nM across captured control Fc (top graph) and captured zFlt4-Fc (bottom graph). Black line denotes fit to a 1:1 model for binding of zVegfcΔNΔC-FLAG to zFlt4-Fc. Kinetic parameters of zVegfcΔNΔC-FLAG binding to zFlt4-Fc are shown in the table. Values are means and standard deviations of fits to the 1:1 binding model, for three independent experiments. (B) Schematic maps of alternative forms of mature zebrafish Vegfd: zVegfdΔNΔC-FLAG (zVegfdΔNΔC), VegfdΔNΔC-FLAG-Cterm (VegfdΔNΔC-Cterm), and zVegfdΔNΔC-Long-FLAG (zVegfdΔNΔC-Long). zVegfdΔNΔC-Long-FLAG has 12 extra residues at the N terminus of the VHD compared to other constructs. F denotes FLAG. (C) Analysis of receptor binding by alternative forms of mature zebrafish Vegfd. Ligands were precipitated from conditioned media of transfected HEK293T cells using receptor-Fc constructs indicated under each blot. Conditioned media of cells transfected with expression vector lacking DNA for ligands was negative control (Control). Ligands were detected by anti-FLAG western blotting (reducing conditions). Input levels of ligands and receptors in all precipitations were controlled as described in the STAR Methods, and all blots were conducted in parallel. Molecular weight markers (kDa) are indicated and expected sizes for ligand subunits are 20–26 kDa. Dotted line indicates where image was spliced to remove irrelevant track. (D and E) At 30 hpf, embryos injected with mRNA for zKdrl-Fc have fewer arterial intersegmental vessels (aISVs) than uninjected embryos, which can be partially rescued by co-injection of vegfd mRNA (D), quantified in (E) (n = 32 embryos for uninjected, n = 25 for zKdrl-Fc, and n = 34 for zKdrl-Fc + Vegfd; ∗∗∗∗p < 0.0001). Scale bar in (D) represents 100 μm and applies to all images. (F) Binding of human VEGFD to zebrafish receptors. Human VEGFDΔNΔC (hVEGFDΔNΔC) was precipitated with constructs indicated under blots and detected by anti-FLAG western blotting. Input levels of ligands and receptors in all precipitations were controlled as described in the STAR Methods, and all blots were conducted in parallel. Media from cells transfected with expression vector lacking ligand DNA was negative control (Control), and zVegfaa121-FLAG (zVegfaa121) and zVegfcΔNΔC-FLAG (zVegfcΔNΔC) were positive controls. Expected sizes for ligand subunits are 20–26 kDa. (G) Binding of zebrafish Vegfd to human receptors. zVegfdΔNΔC-FLAG (zVegfdΔNΔC) was precipitated using human VEGFR2-Fc (hVEGFR2-Fc), human VEGFR3-Fc (hVEGFR3-Fc), or Fc of mouse IgG, and detected by western blotting. Input levels of ligands and receptors in all precipitations were controlled as described in the STAR Methods, and all blots were conducted in parallel. Negative control (Control) was as for (F), and hVEGFDΔNΔC and zVegfcΔNΔC were positive controls. Molecular weight markers (kDa) are indicated. All precipitations and western blots in (C), (F), and (G) were conducted at least three times using fresh media, with results similar to those shown here. Data are represented as the mean ± SEM. |