
Fig. 5
- ID
- ZDB-IMAGE-190919-2
- Genes
- Antibodies
- Publication
- Vogrin et al., 2019 - Evolutionary Differences in the Vegf/Vegfr Code Reveal Organotypic Roles for the Endothelial Cell Receptor Kdr in Developmental Lymphangiogenesis
- All Figures
- Figures for Vogrin et al., 2019
|
Fig. 5
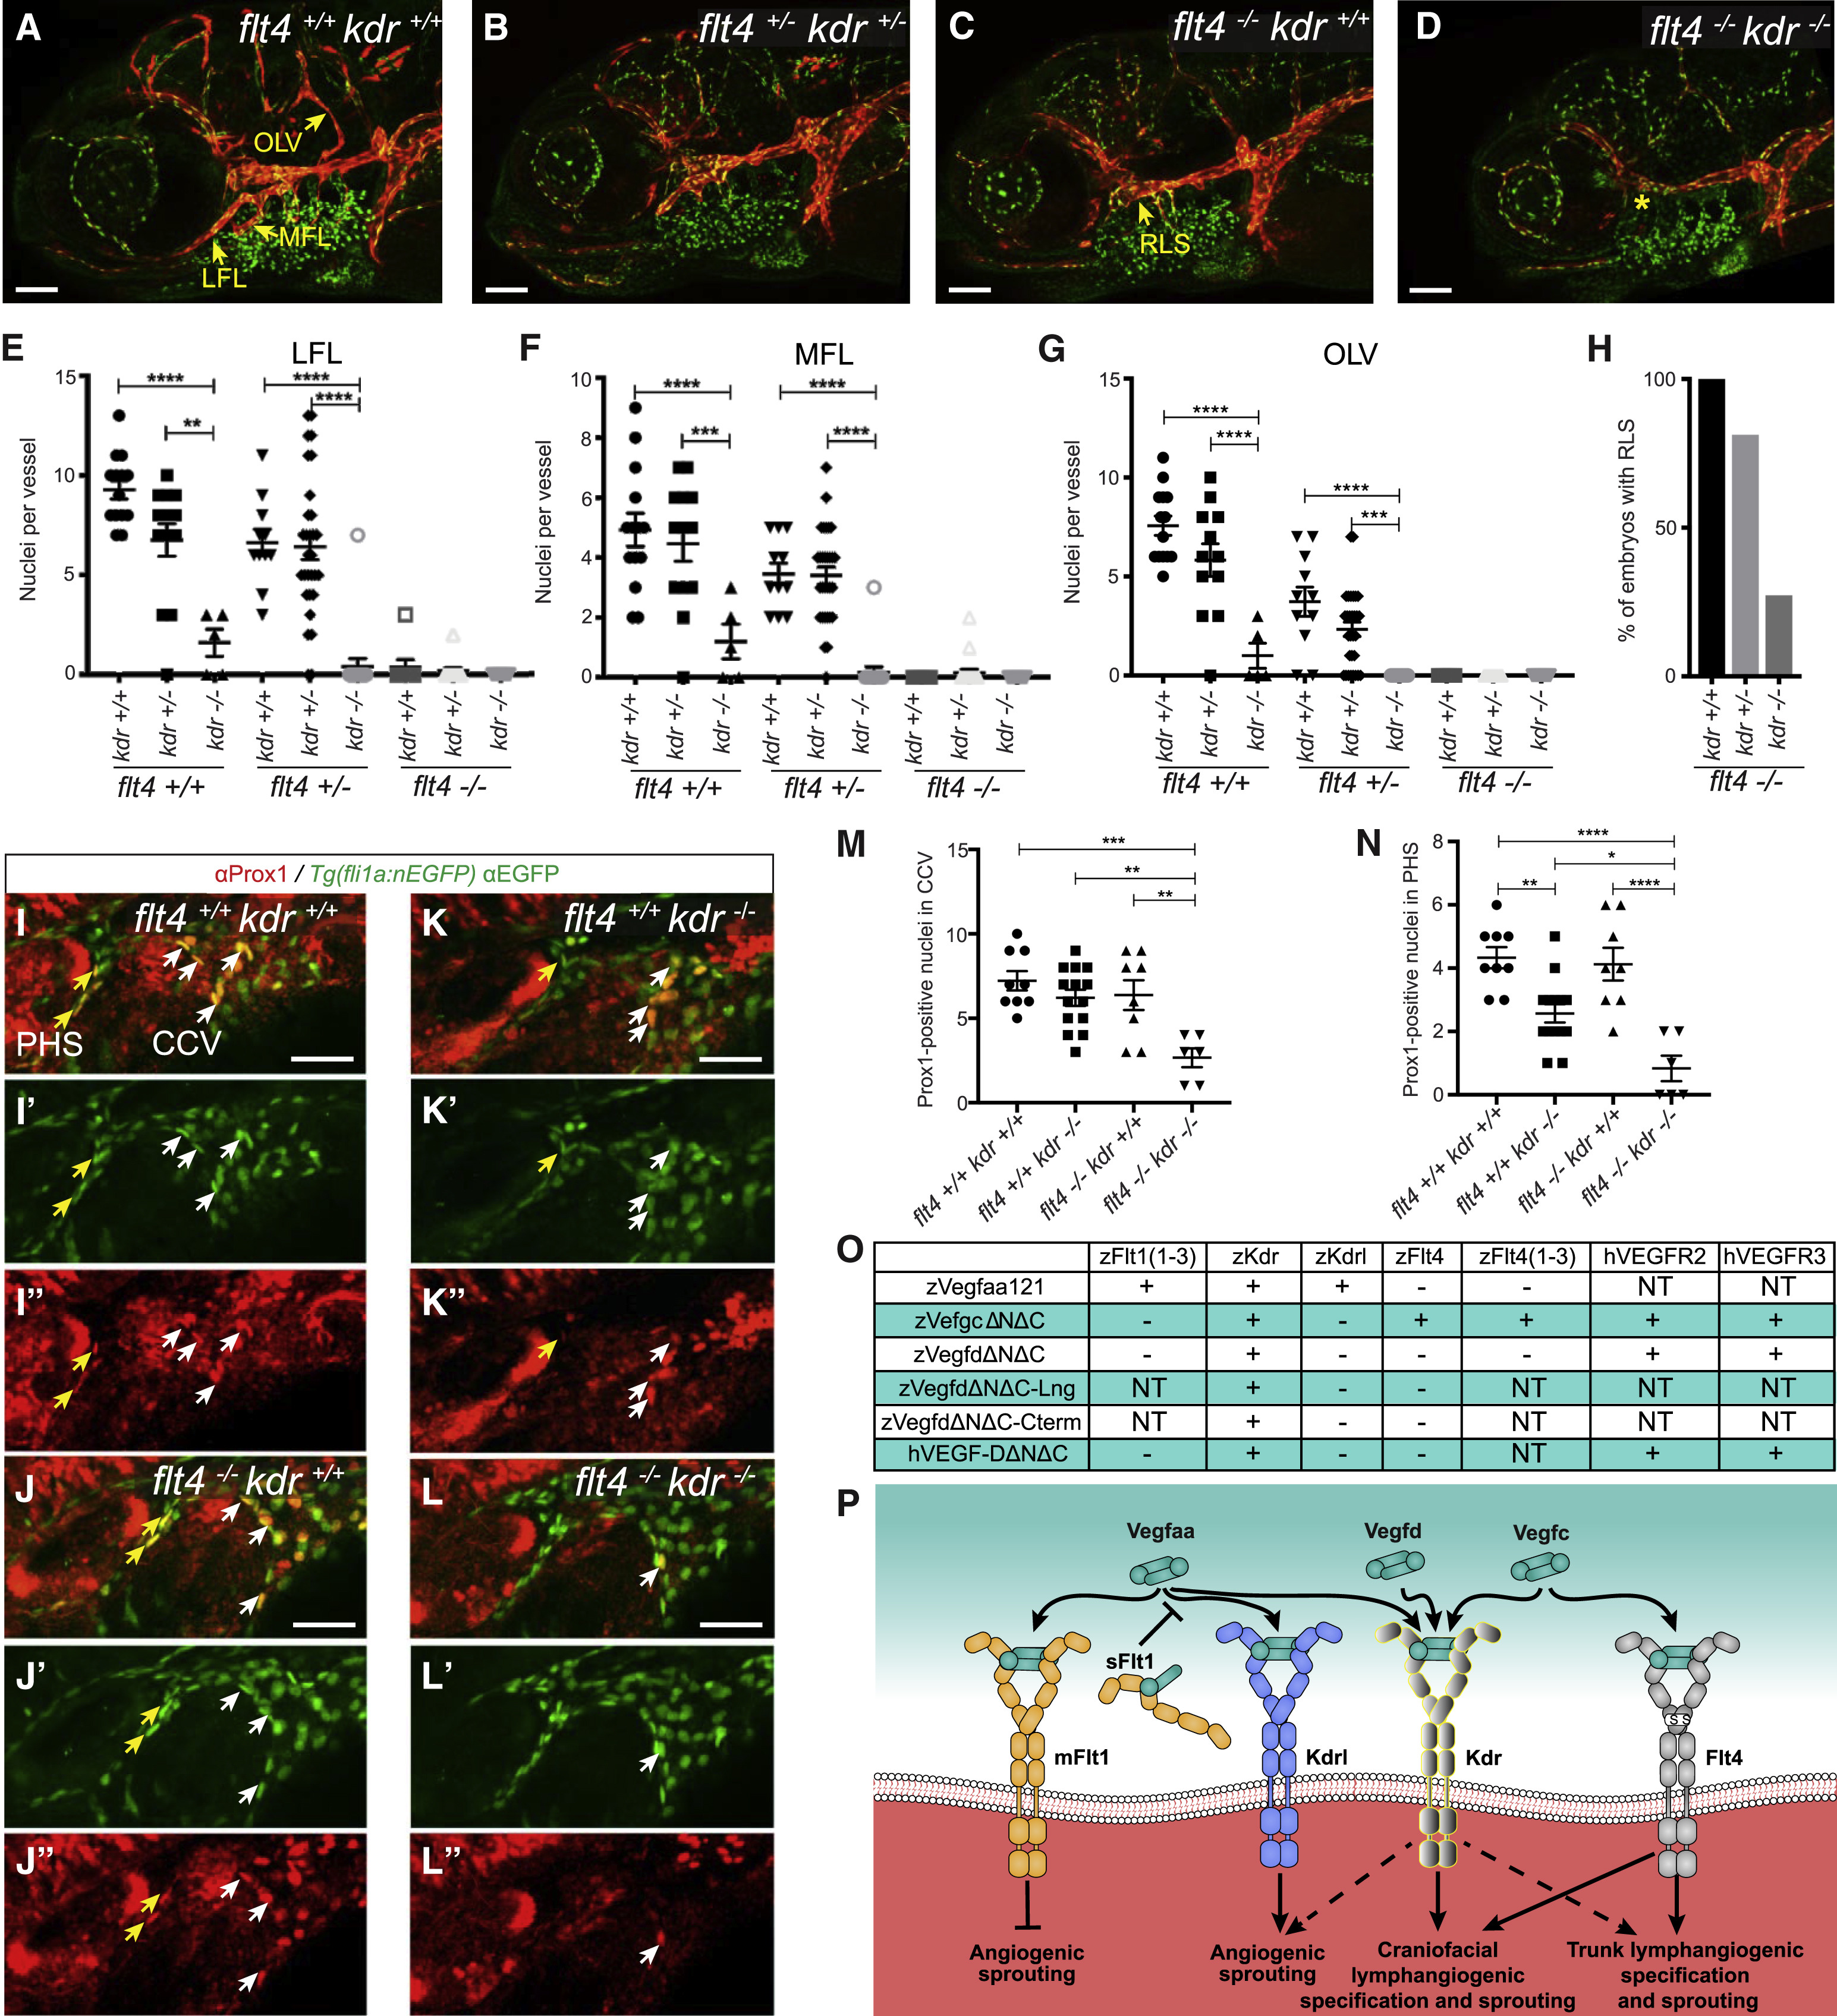
Functional Relationship of Flt4 and Kdr In Vivo, and Summation of Ligand-Receptor Interactions
(A–D) Confocal images showing facial region of 5-dpf Tg(fli1a:nEGFP);Tg(−5.2lyve1b:dsRed) transgenic embryos produced by in-crossing kdruq38bh/flt4hu4602 carriers. Genotypes in (A) are flt4+/+ kdr+/+, (B) flt4+/−kdr+/−, (C) flt−/− kdr+/+, and (D) flt4−/− kdr−/−. In (C) and (D), arrow indicates rostral lymph sac (RLS) and asterisk indicates its absence. All scale bars in (A)–(D) represent 100 μm.
(E–G) Quantification of nuclei in lateral (LFL; E), medial (MFL; F), and otolithic (OLV; G) facial lymphatics in kdruq38bh and flt4hu4602 mutant combinations (flt4+/+/kdr+/+ embryos n = 14; flt4+/+/kdr+/− n = 13; flt4+/+/kdr−/− n = 5; flt4+/−/kdr+/+ n = 11; flt4+/−/kdr+/− n = 30; flt4+/−/kdr−/− n = 17; flt4−/−/kdr+/+ n = 8; flt4−/−/kdr+/− n = 19; flt4−/−/kdr−/− n = 10).
(H) Quantification of RLS formation in flt4hu4602 mutant background reveals kdruq38bh mutants form fewer RLSs than kdr wild-type or heterozygotes (flt4−/−/kdr+/+ embryos n = 8; flt4−/−/kdr+/− n = 19; flt4−/−/kdr−/− n = 10).
(I–L) Confocal images of 36-hpf Tg(fli1a:nEGFP) transgenic embryos, produced by in-crossing kdruq38bh/flt4hu4602 carriers, and immunostaining for Prox1. Merged images; green denotes EGFP-tagged Fli1-positive nuclei and red denotes Prox1.
(I′)–(L′) EGFP-tagged Fli1-positive nuclei only, and (I″)–(L″) show Prox1 only. Yellow arrows indicate Prox1/EGFP-positive nuclei in primary head sinus (PHS); white arrows indicate common cardinal vein (CCV). Genotypes in (I) are flt4+/+ kdr+/+, (J) flt4−/− kdr+/+, (K) flt4+/+ kdr−/−, and (L) flt4−/− kdr−/−. All scale bars in (I)–(L) represent 50 μm and apply to all images.
(M and N) Quantification in CCV (M) and PHS (N) reveals fewer Prox1-positive nuclei in kdruq38bh/flt4hu4602 double mutants (n = 6 embryos), compared to wild-type (n = 9), flt4hu4602 (n = 8), or kdruq38bh (n = 14) mutants. ∗p < 0.05, ∗∗p < 0.01, ∗∗∗p < 0.001, and ∗∗∗∗p < 0.0001.
(O) Table of Vegf ligand-receptor interactions based on pull-down experiments. NT denotes not tested.
(P) Schematic showing binding of zebrafish Vegf ligands to receptors, and downstream events. Mechanisms of organotypic lymphangiogenesis in the craniofacial region and trunk are indicated. mFlt1 denotes full-length transmembrane Flt1; sFlt1 soluble form; dashed arrows compensatory roles toward downstream event.
Data are represented as the mean ± SEM.