
- Title
-
Matrix metalloproteinases (MMPs) mediate leukocyte recruitment during the inflammatory phase of zebrafish heart regeneration
- Authors
- Xu, S., Webb, S.E., Lau, T.C.K., Cheng, S.H.
- Source
- Full text @ Sci. Rep.
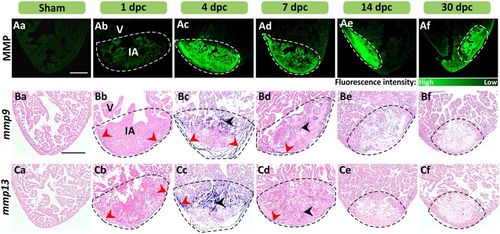
MMP activity and mmp9 and mmp13 expression are enhanced at sites of injury in the heart. (A) In situ zymography was conducted to show the activity of MMP (in green) in representative cryosections of (Aa) intact hearts and in (Ab–Af) injured hearts at 1–30 dpc. (B,C) In situ hybridization was conducted to show the expression of (B) mmp9, and (C) mmp13 (blue labeling), in representative paraffin sections of (Ba, Ca) intact and (Bb–Bf, Cb–Cf) cryoinjured ventricles at 1–30 dpc. The sections were counterstained with Fast Red (pink labeling) to label all the cells. The red and black arrowheads indicate regions of mmp expression in the epicardium and myocardium, respectively. In each panel, the regions bounded by the dashed lines indicate the injured area (IA) of the ventricle (V). Scale bars: 200 µm. |
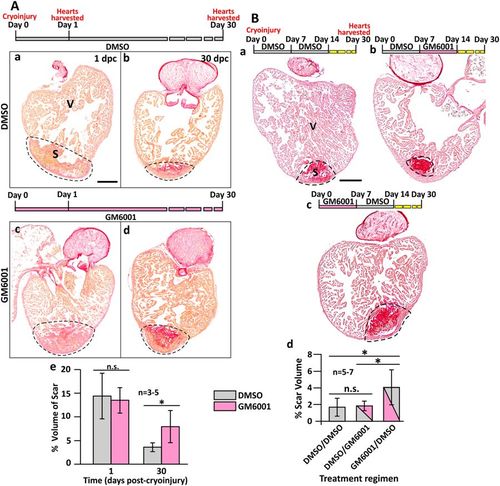
GM6001 inhibits heart regeneration after cryoinjury. (A) Representative picrosirius red stained paraffin sections of wild type fish hearts at (Aa, Ac) 1 dpc and (Ab, Ad) 30 dpc, after the fish were injected with either DMSO (controls) or GM6001 (prepared in DMSO). ‘V’ and ‘S’ are the ventricle and scar (of the injured area), respectively. Scale bar: 200 µm. (Ae) Bar graph to show the percentage of the scar volume in the DMSO- and GM6001-injected fish at 1 dpc and 30 dpc. The data are expressed as mean ± standard deviation of n = 3 to 5 hearts. The asterisk indicates GM6001 data that are significantly different from the DMSO controls at p < 0.05, two-tailed t-test. (B) Representative picrosirius red stained paraffin sections of wild type hearts harvested at 30 dpc, after the fish were injected with: (Ba) DMSO every day for the first 14 dpc; (Bb) DMSO for the first 7 dpc and GM6001 for the next 7 dpc; or (Bc) GM6001 for the first 7 dpc and DMSO for the next 7 dpc. ‘V’ and ‘S’ are the ventricle and scar (of the injured region), respectively. Scale bar: 200 µm. (Bd) Bar graph to show the percentage of scar volume in the ventricle following the different DMSO and GM6001 injection regimens. The data are expressed as mean ± standard deviation of n = 5 to 7 hearts. The asterisks indicate significantly different data at p < 0.05, and ‘n.s.’ indicates results where no statistically significant differences were found, one-way ANOVA with LSD Post-hoc test. PHENOTYPE:
|
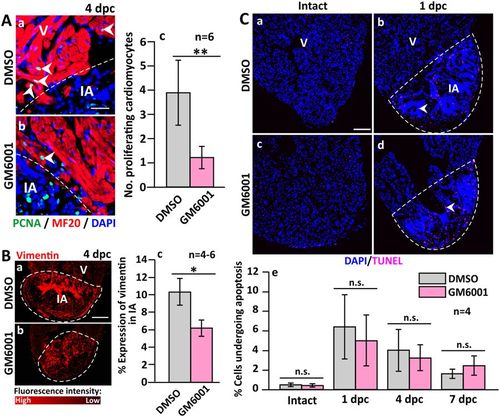
The number of proliferating cardiomyocytes and the accumulation of fibroblasts are reduced (but apoptosis is not affected) in GM6001-treated fish following cryoinjury. (A) Representative paraffin sections showing the margin between the intact ventricle and injured area (IA) in (Aa) DMSO control and (Ab) GM6001-treated fish, which were immunolabelled with MF20 and an anti-PCNA antibody to label the cardiomyocytes and proliferating cells, respectively. The sections were also co-labeled with DAPI to label the nuclei. (Ac) Bar chart to show the numbers of proliferating cardiomyocytes in the margin between the intact ventricle and IA in control and GM6001-treated fish. (Ba,Bb) Representative paraffin sections were immunolabelled with an anti-vimentin antibody to label fibroblasts, after which (Bc) the percentage of vimentin expression in the scar of the DMSO- and GM6001-treated fish at 4 dpc was determined. (C) Representative paraffin sections of intact and cryoinjured hearts after the fish were injected with either: (Ca,Cb) DMSO (controls) or (Cc,Cd) GM6001 (prepared in DMSO). Cells undergoing apoptosis were stained with TUNEL (pink). (Ce) Bar chart to show the percentage of apoptotic cells in the intact ventricle, and in the injured area at 1 dpc to 7 dpc. In (Ac and Bc), the data are expressed as the mean ± standard deviation of n = 4–6 hearts, and the asterisks indicate GM6001 data that are significantly different from the DMSO controls at p < 0.05 (*) and p < 0.01 (**), two-tailed t-test. In (Ce), the data are expressed as the mean ± standard deviation of n = 4 hearts, and n.s. indicates data that are not statistically different, one-way ANOVA with LSD Post-hoc test. |
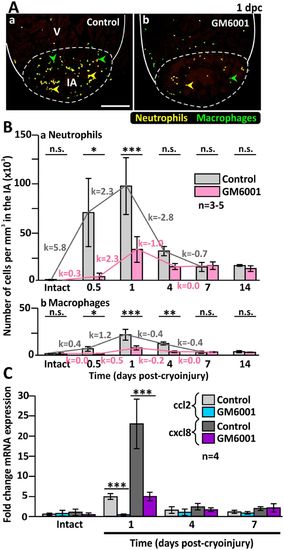
The numbers of inflammatory cells are reduced in the injured heart of GM6001-treated fish. (A) The Tg (coro1a:EGFP; lyz:dsRed) line of fish was used, where macrophages are labelled in green (see green arrowheads), and neutrophils are labelled in yellow (see yellow arrowheads). These images show the localization of macrophages and neutrophils in the injured areas (IA) of ventricles (V) at 1 dpc after the fish were injected with either (Aa) DMSO (controls) or (Ab) GM6001 (prepared in DMSO). The regions bounded by the white dashed lines indicate the IA, and scale bar: 200 µm. (B) Bar graphs to show the numbers of (Ba) neutrophils and (Bb) macrophages per mm3 in the IA of control and GM6001-treated fish at 0.5 dpc to 14 dpc, and in intact ventricles. The k values indicate the change in the numbers of cells per hour. (C) Bar graph to show the fold change in expression of cxcl8 and ccl2 in the intact heart and at 1 dpc, 4 dpc and 7 dpc in both control and GM6001-treated fish. In (B) and (C), the data are expressed as the mean ± standard deviation of n = 3–5 and n = 4 experiments, respectively, and the asterisks indicate GM6001 data that are significantly different from the DMSO controls at p < 0.05 (*), p < 0.01 (**) and p < 0.001 (***); one-way ANOVA with LSD Post-hoc test. |
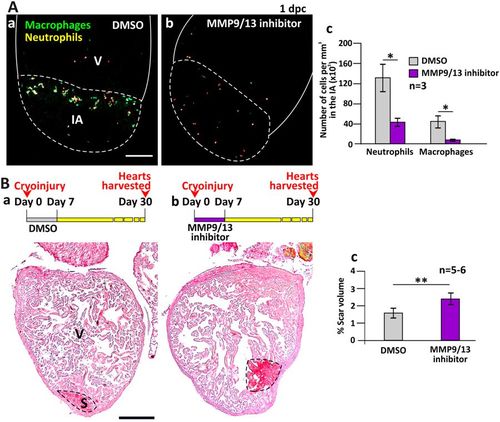
MMP9/13 inhibitor I (MMP9/13 inhibitor) reduced the number of inflammatory cells into the injured area (IA) and reduced the regenerative ability of the heart. (A) Tg (coro1a:EGFP; lyz:dsRed) fish were treated with DMSO (control) or MMP9/13 inhibitor after heart ventricle cryoinjury. These images show the localization of macrophages and neutrophils in the IA of ventricles (V) at 1 dpc. Scale bar: 200 µm. (Ac) Bar graph to show the numbers of neutrophils and macrophages per mm3 in the IA of control and MMP9/13 inhibitor-treated fish at 1 dpc. (B) Representative picrosirius red stained paraffin sections of wild type fish hearts harvested at 30 dpc, after the fish were injected with: (Ba) DMSO or (Bb) MMP9/13 inhibitor, every day for the first 7 dpc. Scale bar: 200 µm. (Bc) Bar graph to show the percentage of scar volume in the ventricle following DMSO or MMP9/13 inhibitor treatment. In (Ac) and (Bc), the data are expressed as mean ± standard deviation of n = 3 and n = 5 to 6 hearts, respectively. The asterisks indicate significantly different data at p < 0.05 (*) and p < 0.01 (**), two-tailed t-test. PHENOTYPE:
|
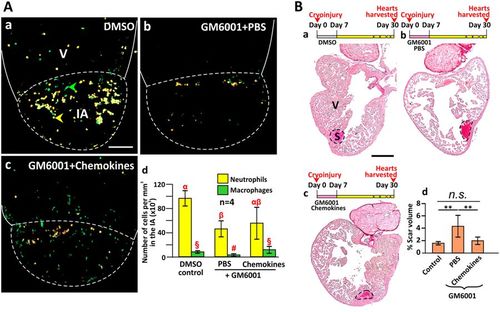
Injection of the chemokines CXCL8 and CCL2 rescued the impaired regeneration caused by GM6001. (A) The heart of Tg (coro1a:EGFP; lyz:dsRed) fish were cryoinjured and injected with (Aa) DMSO alone (control); (Ab) GM6001 and PBS; or (Ac) GM6001 and chemokines, after which the numbers of neutrophils (labeled in yellow) and macrophages (labeled in green) were quantified. Scale bar: 200 µm. (Ad) Bar graph to show the numbers (mean ± standard deviation) of neutrophils and macrophages per mm3 in the IA of fish at 1 dpc following the treatment regimens conducted in (Aa–Ac). Statistical analysis was carried out by One-way ANOVA with LSD Post-hoc test and significant differences (at p < 0.05) are shown by the different symbols (α, β, αβ and §, #) above the bars for the neutrophils and macrophages. (B) Wild type fish hearts were cryoinjured and then either (Bb) PBS or (Bc) chemokines were injected into the injured area following daily treatment with GM6001 during the first week after injury. (Ba) Some fish were injected with DMSO as a blank control. Serial paraffin heart sections were prepared and stained with picrosirius red. ‘V’ and ‘S’ are the ventricle and scar of the IA, respectively. Scale bar: 200 µm. (Bd) Bar graph to show the percentage of scar volume in the ventricle following the different treatments. The data are expressed as mean ± standard deviation of n = 5 to 6 hearts. The asterisks indicate significantly different data at p < 0.01, and ‘n.s.’ indicates results where no statistically significant differences were found, one-way ANOVA with LSD Post-hoc test. |
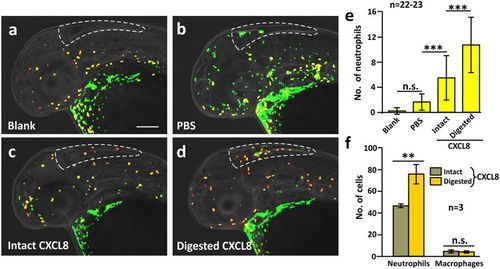
MMP-9-digested CXCL8 exhibited an increased ability to recruit neutrophils in vivo. Intact or MMP-9-digested CXCL8 was injected into the hindbrain of Tg (coro1a: EGFP; lyz: Dsred) zebrafish larvae at 2 dpf. After 90 min, the larvae were fixed and dual-immunolabeled with anti-GFP and anti-RFP antibodies, after which images were acquired by 3D high-resolution light-sheet microscopy under laser illumination. (a–d) Representative images to show the neutrophils (yellow) and macrophages (green) in the hindbrain of (a) blank or (b) PBS-injected control fish, as well as after injection of either (c) intact or (d) MMP-9-digested CXCL8. Scale bar: 200 μm. (e) Bar chart to show the mean ± standard deviation number of neutrophils in the hindbrain of zebrafish following the various treatments described above. The asterisks (***) represent significant differences when comparing the various groups at p < 0.001, and ‘n.s.’ indicates data that were not significantly different, one-way ANOVA with LSD Post-hoc test. (f) A cell suspension from 4 dpf larvae of the Tg (coro1a: EGFP; lyz: Dsred) line was prepared. An in vitro cell migration assay was performed and the numbers of neutrophils (yellow), and macrophages (green) were quantified. Bar chart to show the mean ± standard deviation numbers of neutrophils and macrophages that migrated towards intact or MMP-9-digested CXCL8. The asterisks (**) indicate intact and digested CXCL8 data that were significantly different at p < 0.01, and ‘n.s.’ indicates data that were not significantly different, two-tailed t-test. |
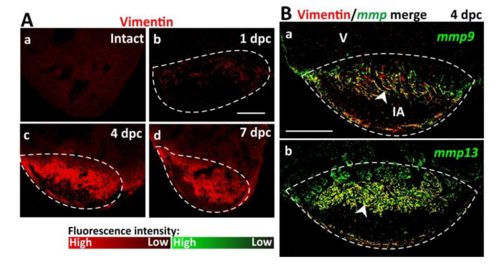
Elevated numbers of vimentin-positive fibroblasts in the injured area contribute to MMP production. (A) Immunofluorescence images of cryosections to show the localization of vimentin (in red) and hence the distribution of fibroblasts in (Aa) intact (control) and (Ab-Ad) cryoinjured wild type heart ventricles (V) at: (Ab) 1 dpc, (Ac) 4 dpc, and (Ad) 7 dpc. (B) Fluorescence in situ hybridization (FISH) was conducted to show the expression of (Ba) mmp9 and (Bb) mmp13 (in green), after which immunohistochemistry was performed to show the localization of vimentin (in red) in the IA of wild type heart ventricles at 4 dpc. These representative images of paraffin sections show the FISH and immunofluorescence data when merged. Regions of co-localization appear in yellow (see white arrowheads). In each panel, the regions bounded by the dashed white lines indicate the IA. Scale bars: 200 μm. |
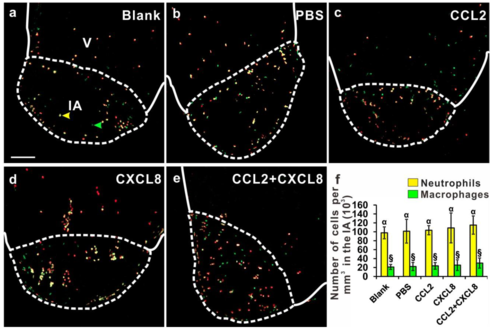
Injection of the chemokines did not affect the number of inflammatory cells in the injured area (IA). Using the Tg (coro1a:EGFP; lyz:dsRed) line of fish, the heart was cryoinjured and either: (a) not injected (as a blank control), or else injected with: (b) PBS; (c) CCL2; (d) CXCL8; or (e) CCL2 and CXCL8, after which the numbers of neutrophils (labeled in yellow) and macrophages (labeled in green) were quantified. Scale bar, 200 μm. (f) Bar graph to show the numbers (mean ± standard deviation, n= 5 to 6 hearts) of neutrophils and macrophages per mm3 in the IA of fish at 1 dpc following the treatment regimens conducted in (a-e). The number of neutrophils in cryoinjured hearts following the treatments described in (a-e) were 95.7±13.3, 101.4 ±9.1, 103.6±10.1, 108.7±33.5 and 115.1±20.4 ×10³ cells per mm3, respectively; and the number of macrophages were 20.2±5.6, 22.3±9.4, 23.7±7.4, 25.4±12.0 and 29.9±11.3 ×10³ cells per mm3, respectively. Statistical analysis was carried out by One-way ANOVA and significant differences (at p<0.05) are shown by the different symbols above the bars. |