
|
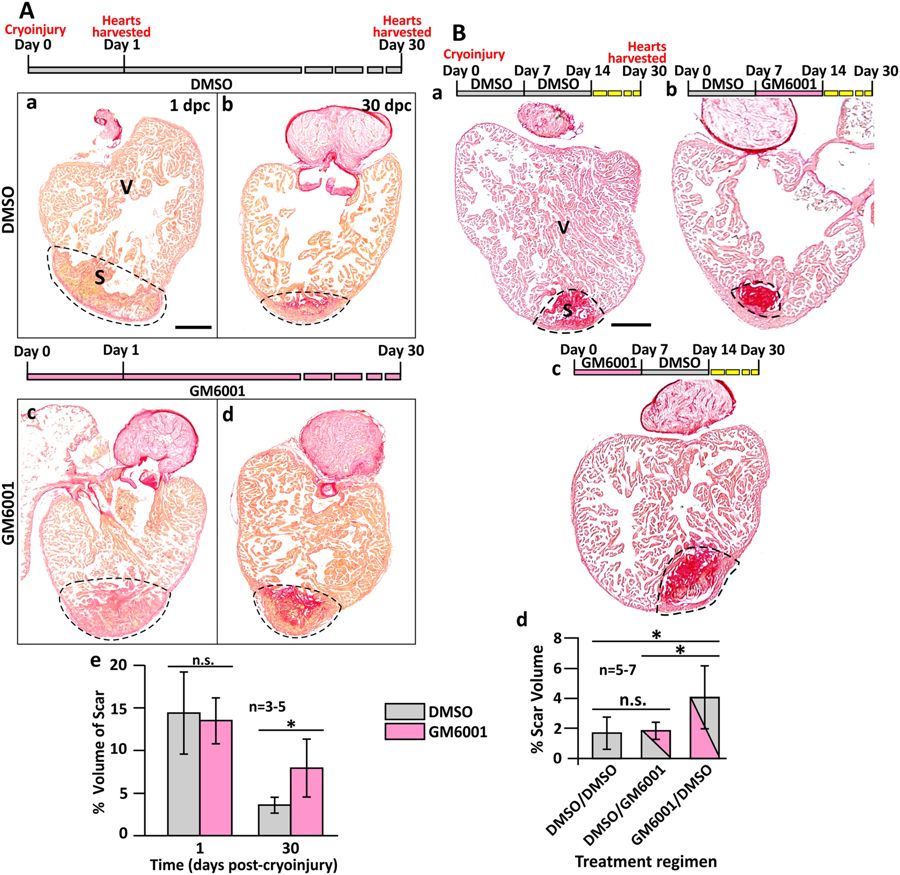
Fig. 2
GM6001 inhibits heart regeneration after cryoinjury. (A) Representative picrosirius red stained paraffin sections of wild type fish hearts at (Aa, Ac) 1 dpc and (Ab, Ad) 30 dpc, after the fish were injected with either DMSO (controls) or GM6001 (prepared in DMSO). ‘V’ and ‘S’ are the ventricle and scar (of the injured area), respectively. Scale bar: 200 µm. (Ae) Bar graph to show the percentage of the scar volume in the DMSO- and GM6001-injected fish at 1 dpc and 30 dpc. The data are expressed as mean ± standard deviation of n = 3 to 5 hearts. The asterisk indicates GM6001 data that are significantly different from the DMSO controls at p < 0.05, two-tailed t-test. (B) Representative picrosirius red stained paraffin sections of wild type hearts harvested at 30 dpc, after the fish were injected with: (Ba) DMSO every day for the first 14 dpc; (Bb) DMSO for the first 7 dpc and GM6001 for the next 7 dpc; or (Bc) GM6001 for the first 7 dpc and DMSO for the next 7 dpc. ‘V’ and ‘S’ are the ventricle and scar (of the injured region), respectively. Scale bar: 200 µm. (Bd) Bar graph to show the percentage of scar volume in the ventricle following the different DMSO and GM6001 injection regimens. The data are expressed as mean ± standard deviation of n = 5 to 7 hearts. The asterisks indicate significantly different data at p < 0.05, and ‘n.s.’ indicates results where no statistically significant differences were found, one-way ANOVA with LSD Post-hoc test.