
- Title
-
Claudin5a is required for proper inflation of Kupffer's vesicle lumen and organ laterality
- Authors
- Kim, J.G., Bae, S.J., Lee, H.S., Park, J.H., Kim, K.W.
- Source
- Full text @ PLoS One

Expression patterns of cldn5a and cldn5b. (A—C) In situ hybridization of cldn5a. Specific expression of cldn5a in KV at 6 ss, marked by a red rectangle (A). Expression of cldn5a in neuroepithelial cells at 18 ss (B) and 24 hpf (C), marked by a red arrow. (D—F) In situ hybridization of cldn5b. No obvious expression of cldn5b at 6 ss (D). Expression of cldn5b in dorsal aorta (DA) and intersegmental vessels (ISV) at 18 ss (E) and 24 hpf (F). DA and ISV are marked by a green arrow and rectangle, respectively. (G—M) Maximum intensity projection images of Cldn5 (red) and sox17:egfp-positive KV cells (green) in 90% epiboly to 13 ss embryos. (N) Single plane image of Cldn5 (red) and sox17:egfp-positive KV cells (green) in 3 ss embryos. Scale bar: 20 μm. EXPRESSION / LABELING:
|

Laterality of heart was disrupted in cldn5a morphants. (A—H) Visualization of a heart by in situ hybridization of cmlc1 in 30 hpf embryos. Representative images of control morphants (A), cldn5a morphants (B), DFC cldn5a morphants (C), and yolk cldn5a morphants (D). (E) Stacked bar graph (blue; normal, orange; middle, grey; reversed, control morphants; n = 45, cldn5a morphants; n = 33, DFC control morphants; n = 71, DFC cldn5a morphants; n = 37, yolk control morphants; n = 25, yolk cldn5a morphants; n = 31). Representative images of control morphants with mCherry (F), cldn5a morphants with mCherry (G), cldn5a morphants with mCherry-cldn5a (H). (I) Stacked bar graph (blue; normal, orange; middle, grey; reversed, control morphants with mCherry; n = 132, cldn5a morphants with mCherry; n = 111, cldn5a morphants with mCherry-cldn5a; n = 115). * depicts p < 0.05. |
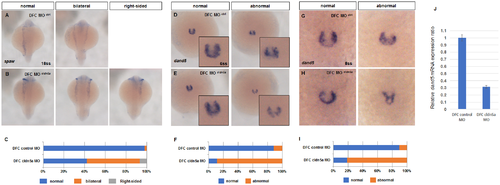
Expressions of spaw and dand5 were disrupted in DFC cldn5a morphants. (A—B) Visualization of spaw by in situ hybridization in 18 ss embryos. Representative images of DFC control morphants (A) and DFC cldn5a morphants (B). (C) Stacked bar graph (blue; normal, orange; bilateral, grey; right-sided, DFC control morphants; n = 48, DFC cldn5a morphants; n = 45). (D—E) Visualization of dand5 by in situ hybridization in 6 ss embryos. Representative images of DFC control morphants (D) and DFC cldn5a morphants (E). (F) Stacked bar graph (blue; normal, orange; abnormal, DFC control morphants; n = 26, DFC cldn5a morphants; n = 36). (G—H) Visualization of dand5 by in situ hybridization in 8 ss embryos. Representative images of DFC control morphants (G) and DFC cldn5a morphants (E). (I) Stacked bar graph (blue; normal, orange; abnormal, DFC control morphants; n = 76, DFC cldn5a morphants; n = 82). (J) Relative dand5 mRNA expression in DFC cldn5a morphants versus DFC control morphants at 8 ss. Error bars indicate s.e.m. EXPRESSION / LABELING:
PHENOTYPE:
|

ZFIN is incorporating published figure images and captions as part of an ongoing project. Figures from some publications have not yet been curated, or are not available for display because of copyright restrictions. PHENOTYPE:
|

Downregulation of cldn5a resulted in defective KV lumen in zebrafish. (A—F) Maximum intensity projection images of ZO-1 (grey) and sox17:egfp-positive KV cells (green) in 6 ss, 8 ss and 10 ss embryos. Representative images of the DFC control morphants (A—C) and DFC cldn5a morphants (D—F). (G) Statistical box and whisker graph (DFC control morphants at 6 ss; n = 20, DFC control morphants at 8 ss; n = 31, DFC control morphants at 10 ss; n = 15, DFC cldn5a morphants at 6 ss; n = 28, DFC cldn5a morphants at 8 ss; n = 21, DFC cldn5a morphants at 10 ss; n = 18). Scale bar: 20 μm. PHENOTYPE:
|

Treatment of forskolin and IBMX failed to recover the KV lumen size in DFC cldn5a morphants. (A—D) Maximum intensity projection images of ZO-1 in 6 ss embryos. Representative images of DFC control morphants treated with DMSO (A) or forskolin/IBMX (B). Representative images of DFC cldn5a morphants treated with DMSO (C) or forskolin/IBMX (D). (E) Statistical column bar graph (DFC control morphants with DMSO; n = 30, DFC control morphants with forskolin/IBMX; n = 28, DFC cldn5a morphants with DMSO; n = 19, DFC cldn5a morphants with forskolin/IBMX; n = 22). *** depicts p < 0.001, ** depicts p < 0.01, N.S. depicts p > 0.05. Error bars indicate s.e.m. Scale bar: 20 μm. PHENOTYPE:
|
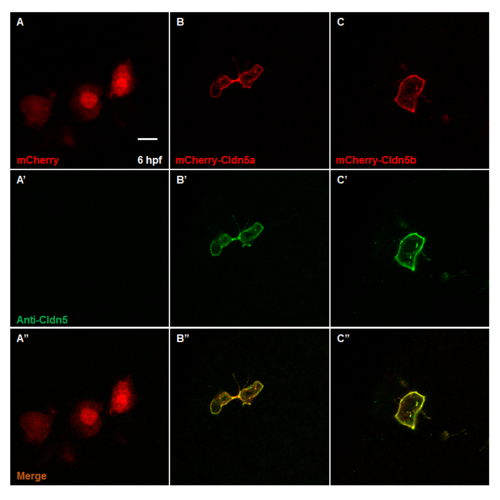
Expression patterns and immunoreactivity of recombinant mCherry, mCherry-Cldn5a and mCherry-cldn5b. (A—C) Expression patterns of recombinant proteins in 6 hpf embryo. Representative images of recombinant mCherry (A), mCherry-Cldn5a (B) and mCherry-Cldn5b (C). (A’–C’) Immunoreactivity to anti-mammal Cldn5 antibody of recombinant proteins. Representative images of recombinant mCherry (A’), mCherry-Cldn5a (B’) and mCherry-Cldn5b (C’). Scale bar: 20 μm. |
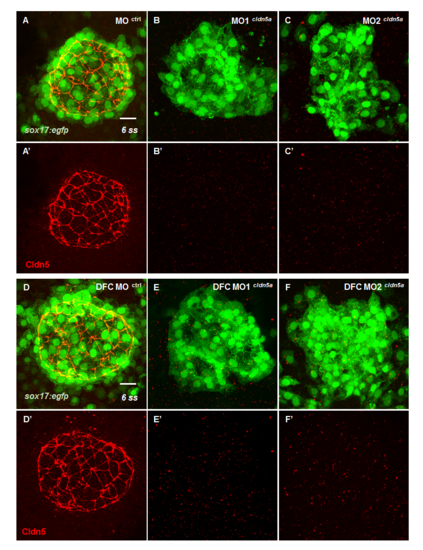
Expression of Cldn5 in KV was ablated by two types of cldn5a translation-blocking MO. (A—F) Maximum intensity projection images of Cldn5 (red) and sox17:egfp-positive KV cells (green) in 6 ss embryos. Representative images of standard control MO injected embryo (n = 9) (A), cldn5a translation-blocking MO1 injected embryo (n = 11) (B), cldn5a translation-blocking MO2 injected embryo (n = 11) (C), DFC-specific control morphants (n = 8) (D), DFC-specific cldn5a MO1 injected embryo (n = 6) (E), and DFC-specific cldn5a MO2 injected embryo (n = 7) (F). Scale bar: 20 μm. EXPRESSION / LABELING:
PHENOTYPE:
|
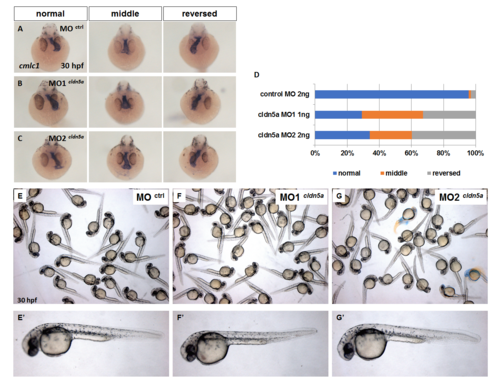
Gross morphology and heart laterality defects of cldn5a MO1 and MO2 injected embryos. (A—C) Gross morphology of control morphants (A), cldn5a MO1 injected embryo (B), and cldn5a MO2 injected embryo (C). (D—F) Visualization of heart by in situ hybridization of cmlc1 in 30 hpf embryos. Representative images of control morphants (D), cldn5a MO1 injected embryo (E), and cldn5a MO2 injected embryo (F). (E) Statistical stacked bar graph (blue; normal, orange; middle, grey; reversed, control morphants; n = 68, cldn5a MO1 injected embryos; n = 55, and cldn5a MO2 injected embryos; n = 53). PHENOTYPE:
|
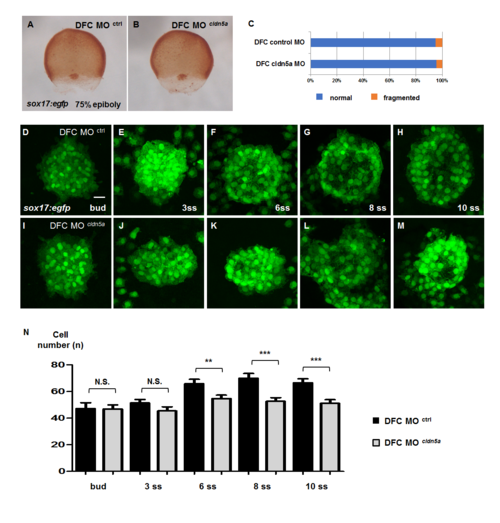
Status of DFC cluster and KV consisting cell number in DFC cldn5a morphants. (A—B) Visualization of DFCs by immunostaining of sox17-promoter induced EGFP in 75% epiboly embryos. Representative images of DFC control morphants (A) and DFC cldn5a morphants (B). (C) Statistical stacked bar graph (blue; normal, orange; fragmented, DFC control morphants; n = 22, DFC cldn5a morphants; n = 38). (D—M) Maximum intensity projection images of sox17:egfp-positive KV lineage cells in DFC control and cldn5a morphants from bud to 10 ss. (D—H) Representative images of the DFC control morphants. (I—M) Representative images of the DFC cldn5a morphants. (N) Statistical column bar graph (DFC control morphants at bud; n = 18, DFC cldn5a morphants at bud; n = 18, DFC control morphants at 3 ss; n = 25, DFC cldn5a morphants at 3 ss; n = 30, DFC control morphants at 6 ss; n = 23, DFC cldn5a morphants at 6 ss; n = 31, DFC control morphants at 8 ss; n = 19, DFC cldn5a morphants at 8 ss; n = 20, DFC control morphants at 10 ss; n = 16, DFC cldn5a morphants at 10 ss; n = 19). *** depicts p < 0.001, ** depicts p < 0.01, N.S. depicts p > 0.05. Error bars indicate s.e.m. Scale bar: 20 μm. PHENOTYPE:
|
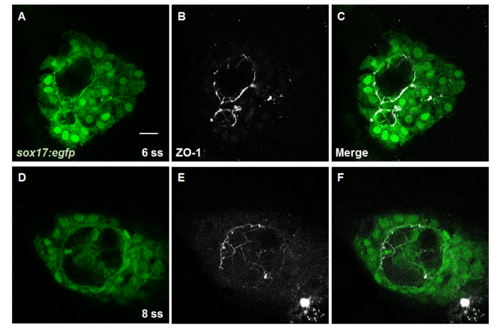
Localization of ZO-1 was not altered in DFC cldn5a morphants. (A—F) Single plane images of ZO-1 (grey) and sox17:egfp-positive KV cells (green) in 6 ss and 8 ss embryos. Representative images of DFC cldn5a morphants at 6 ss (A—C) and 8 ss (D—F). Scale bar: 20 μm. |
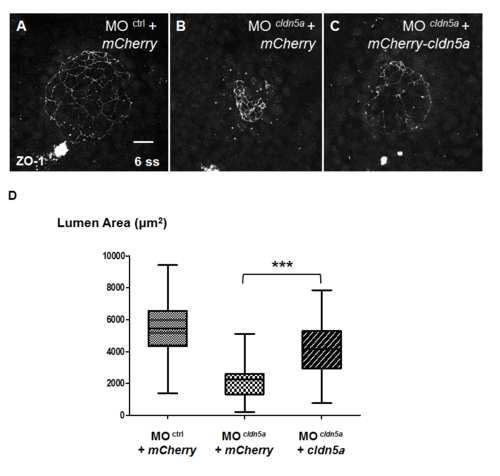
KV lumen area of cldn5a morphants was restored by exogenous cldn5a mRNA. (A—C) Maximum intensity projection images of ZO-1 in 6 ss embryos. Representative images of control morphants with mCherry (A), cldn5a morphants with mCherry (B), and cldn5a morphants with mCherry-cldn5a (C). (D) Statistical box and whisker graph (control morphants with mCherry; n = 25, cldn5a morphants with mCherry; n = 39, cldn5a morphants with mCherry-cldn5a; n = 43) *** depicts p < 0.001. Error bars indicates s.e.m. Scale bar: 20 μm. |

Laterality of heart was disrupted in cldn5a crispants. (A) Partial nucleotide sequences of cldn5a coding sequence (1–150 among 648) and two types of cldn5a targeting gRNA sequences. (B) Representative images of WT-like, type1 and type2 embryos at 30 hpf. (C) Stacked bar graph (blue; WT-like, orange; type1, grey; type2, WT; n = 24, 40 pg of gRNA1 injected embryos; n = 45, 40 pg of gRNA2 injected embryos; n = 41, 80 pg of cas9 mRNA injected embryos; n = 52, 40 pg of gRNA1 and 80 pg of cas9 mRNA injected embryos; n = 55, 40 pg of gRNA2 and 80 pg of cas9 mRNA injected embryos; n = 42). (D—F) Visualization of a heart by in situ hybridization of cmlc1 in 30 hpf embryos. Representative images of WT (F), gRNA1 crispants (G), and gRNA2 crispants (H). (G) Stacked bar graph (blue; normal, orange; middle, grey; reversed, WT; n = 24, only gRNA1 injected embryos; n = 43, only gRNA2 injected embryos; n = 40, only cas9 mRNA injected embryos; n = 52, gRNA1 crispants; n = 28, gRNA2 crispants; n = 36). (H) T7E1 analysis of cldn5a crispants. (I) Representative mutations of cldn5a gene in gRNA2 crispants. PHENOTYPE:
|