
|
Fig. 1
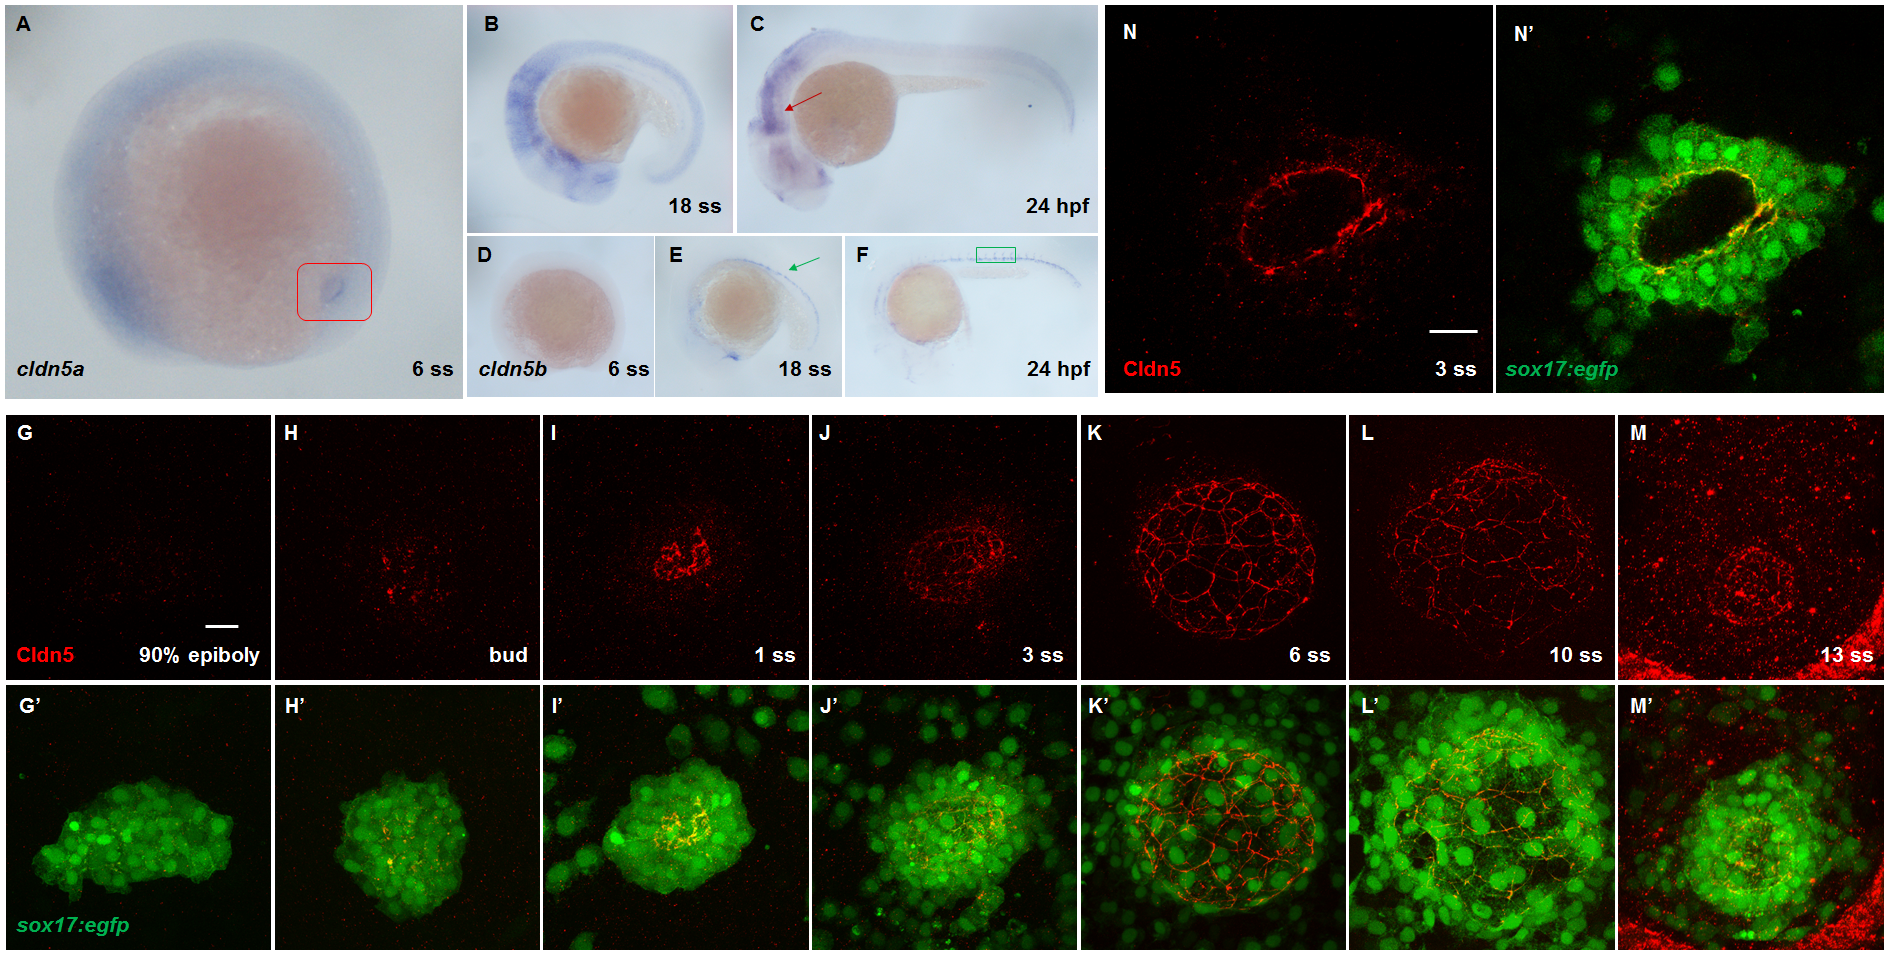
Expression patterns of cldn5a and cldn5b.
(A—C) In situ hybridization of cldn5a. Specific expression of cldn5a in KV at 6 ss, marked by a red rectangle (A). Expression of cldn5a in neuroepithelial cells at 18 ss (B) and 24 hpf (C), marked by a red arrow. (D—F) In situ hybridization of cldn5b. No obvious expression of cldn5b at 6 ss (D). Expression of cldn5b in dorsal aorta (DA) and intersegmental vessels (ISV) at 18 ss (E) and 24 hpf (F). DA and ISV are marked by a green arrow and rectangle, respectively. (G—M) Maximum intensity projection images of Cldn5 (red) and sox17:egfp-positive KV cells (green) in 90% epiboly to 13 ss embryos. (N) Single plane image of Cldn5 (red) and sox17:egfp-positive KV cells (green) in 3 ss embryos. Scale bar: 20 μm.