
- Title
-
NMN Deamidase Delays Wallerian Degeneration and Rescues Axonal Defects Caused by NMNAT2 Deficiency In Vivo
- Authors
- Di Stefano, M., Loreto, A., Orsomando, G., Mori, V., Zamporlini, F., Hulse, R.P., Webster, J., Donaldson, L.F., Gering, M., Raffaelli, N., Coleman, M.P., Gilley, J., Conforti, L.
- Source
- Full text @ Curr. Biol.
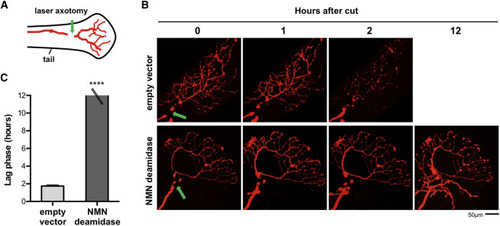
NMN Deamidase Blocks Wallerian Degeneration in Zebrafish Larvae (A) Schematic representation of larval zebrafish tail showing the location of the sensory (Rohon-Beard) axon and the site of injury (green arrow). (B) One-cell-stage emrbyos were injected with plasmids for DsRed and NMN deamidase or empty vector. Time-lapse fluorescent images show DsRed-expressing axons in empty vector or NMN deamidase embryos after cut (green arrow shows the location of cut site). Axons have degenerated within 2 hr in the empty vector control, whereas NMN deamidase-expressing axons are preserved up to at least 12 hr. (C) Length of the lag phase (time between the cut and the first sign of degeneration) in control or NMN deamidase-expressing axons (mean ± SEM; empty vector n = 9, NMN deamidase n = 8; Student’s t test, ∗∗∗∗p < 0.0001). |
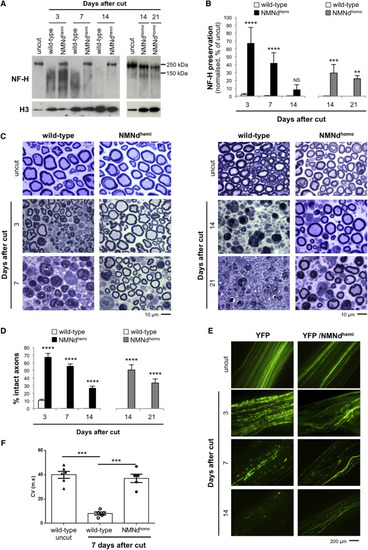
NMN Deamidase Expression Confers Morphological and Functional Preservation of Transected Axons (A) Western blot showing reduced neurofilament heavy chain (NF-H) degradation in tibial nerve at the indicated times after sciatic nerve transection. Degradation is delayed in NMNdhemi and NMNdhomo mice compared to wild-type controls. (B) Quantification of NF-H band intensity after normalization to histone 3 (H3) in wild-type, NMNdhemi, and NMNdhomo mice. Less nerve lysate from uncut nerve was used per lane to avoid overloading and progressively higher amounts loaded for cut nerves (as degeneration increased) to better visualize the intact NF-H and smear of degradation products. We corrected for this by normalizing to the loading control band and expressing values as a percentage of the normalized value in uncut nerve (mean ± SD; n = 3–4; two-way ANOVA followed by Bonferroni post hoc test, ∗∗p < 0.01, ∗∗∗p < 0.001, and ∗∗∗∗p < 0.0001; NS, non-significant). (C and D) Light microscopy images of sciatic nerves from wild-type, NMNdhemi, and NMNdhomo mice at the indicated time points after cut (C) and quantification of the percentage of intact axons (D) (mean ± SD; n = 3; two-way ANOVA followed by Bonferroni post hoc test, ∗∗∗∗p < 0.0001). (E) Fluorescent images of sciatic nerves from YFP and YFP/NMNdhemi mice at the indicated time points after cut. Axon continuity is better preserved in the NMN deamidase-expressing axons. (F) Conduction velocities measured in uncut nerves or 7 days after cut via stimulation of sciatic nerve to evoke electromyographic activity (mean ± SEM; n = 5–6; one-way ANOVA, ∗∗∗p < 0.001). See also Figure S1. |
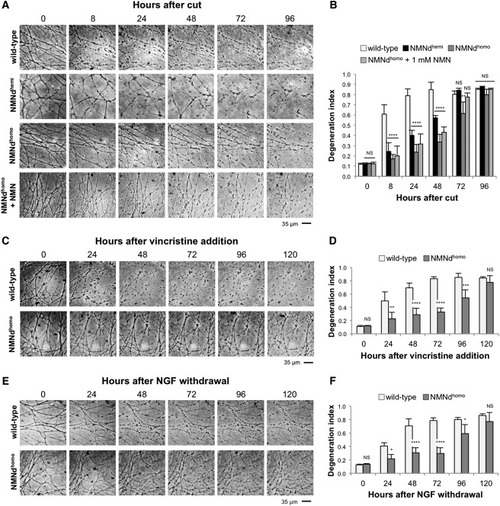
NMN Deamidase Protection Is Neuron Specific and Effective against Various Toxic Insults (A) Representative bright-field images of transected neurites in wild-type, NMNdhemi, and NMNdhomo SCG cultures. Transected neurites expressing NMN deamidase show morphological continuity several days after axotomy. (B) Quantification of the degeneration index in experiments described in (A). (C) Representative bright-field images of neurites in wild-type and NMNdhomo SCG cultures at the indicated time points after 20 nM vincristine addition. (D) Quantification of the degeneration index in experiments described in (C). (E) Representative bright-field images of neurites in wild-type and NMNdhomo SCG cultures at the indicated time points after NGF withdrawal. (F) Quantification of the degeneration index in experiments described in (E). Degeneration index in (B), (D), and (F) was calculated from three fields per sample in three independent experiments (mean ± SD; two-way ANOVA followed by Bonferroni post hoc test, ∗p < 0.05, ∗∗p < 0.01, ∗∗∗p < 0.001, and ∗∗∗∗p < 0.0001; NS, non-significant). See also Figure S3. |
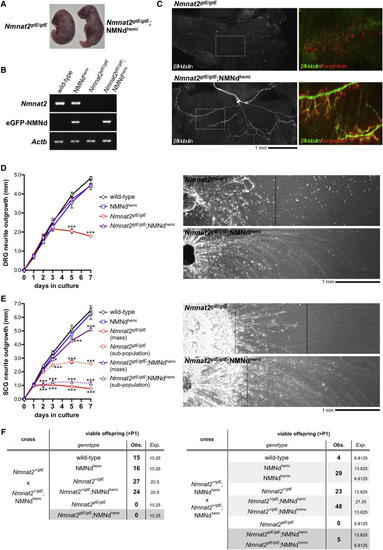
Expression of NMN Deamidase Rescues Axon Defects in Mice Lacking NMNAT2 (A) Representative gross morphology of newborn Nmnat2gtE/gtE and Nmnat2gtE/gtE;NMNdhemi pups. (B) RT-PCR analysis of Nmnat2, eGFP-NMN deamidase, and Actb (sample control) mRNA in E18.5 brain from embryos of the indicated genotypes (images representative of n = 3). (C) βIII-tubulin immunostaining (left-hand images) revealing the presence of phrenic nerve terminal branches in a Nmnat2gtE/gtE;NMNdhemi diaphragm. These are invariantly absent from Nmnat2gtE/gtE diaphragms. Boxed regions are magnified (right). Acetylcholine receptor (AChR) clusters are labeled by counter-staining with bungarotoxin-TRITC. Innervation of AChR clusters is only evident in the Nmnat2gtE/gtE;NMNdhemi diaphragm (images representative of n = 3 Nmnat2gtE/gtE and n = 5 Nmnat2gtE/gtE;NMNdhemi diaphragms). Innervation in Nmnat2gtE/gtE;NMNdhemi diaphragms is superficially similar to that in wild-type and NMNdhemi controls (data not shown). (D and E) Radial neurite outgrowth from DRG explants (D) and radial neurite outgrowth from SCG explants (E). Ganglia were taken from E18.5 embryos of the genotypes listed and outgrowth followed over 7 days in culture (mean radial extension in mm ± SEM; average of two ganglia per embryo for n = 3–5 embryos per genotype; two-way repeated-measures ANOVA with Dunnett’s multiple comparisons post hoc tests of wild-type versus other groups, ∗p < 0.05 and ∗∗∗p < 0.001). Representative images of neurite outgrowth at 7 days for Nmnat2gtE/gtE and Nmnat2gtE/gtE;NMNdhemi DRG (D) and SCG (E) cultures are shown to the right of each graph in each panel. Nmnat2gtE/gtE;NMNdhemi DRG and SCG neurite outgrowth (from ganglia positioned on the left) extends beyond the right-hand edge of the images. Two populations of neurites can be differentiated in Nmnat2gtE/gtE and Nmnat2gtE/gtE;NMNdhemi SCG cultures (E); most Nmnat2gtE/gtE neurites show severely retarded outgrowth (mass, solid line), with a subpopulation extending further (dashed line); most Nmnat2gtE/gtE;NMNdhemi neurites instead show near-normal outgrowth (mass, solid line), while a subpopulation shows severely limited outgrowth (dashed line). (F) Viability past post-natal day 1 (P1) for offspring from Nmnat2+/gtE × Nmnat2+/gtE;NMNdhemi and Nmnat2+/gtE;NMNdhemi × Nmnat2+/gtE;NMNdhemi matings. |
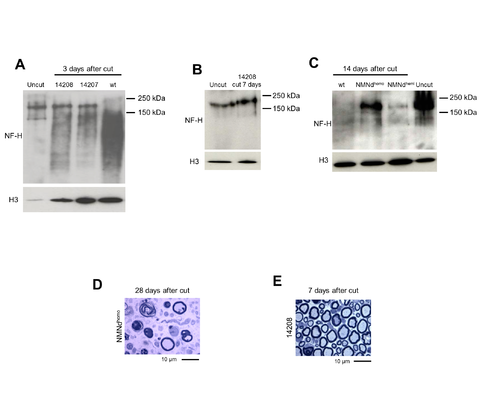
Protection of injured axons in NMN deamidase transgenic mice, related to Figure 3. (A) Western blot showing the extent of NF-H degradation in distal tibial nerve of founder 14207 and 14208 (NMNdhemi) mice 3 days after cut (relative to uncut and cut wild-type (wt) nerves). (B) Western blot showing NF-H degradation 7 days after cut in a founder 14208-derived NMNdhemi mouse (sterile offspring of founder 14208). (C) Comparison of NF-H degradation in NMNdhemi and NMNdhomo mice (founder 14209-derived line) at 2 weeks after cut. In all the blots, histone H3 was used as a loading control. (D) Light microscopy images of sciatic nerves of an NMNdhomo mouse (founder 14209-derived line) 28 days after axotomy and (E) a founder 14208-derived NMNdhemi mouse 7 days after cut. Of note, protection at 7 days in the 14208-derived NMNdhemi mouse appears stronger than that observed in line 14209-derived NMNdhemi mice (Figure 3C). This is consistent with the higher enzymatic activity detected in tissue from founder 14208 compared to line 14209. |
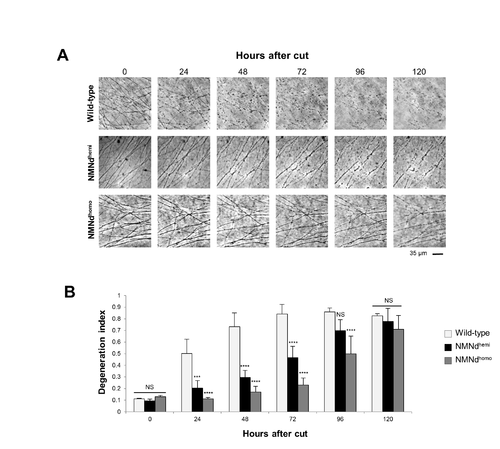
NMN deamidase delays injury-induced axon degeneration in DRG neurons, related to Figure 5. (A) Representative bright-field images of transected neurites in wild-type, NMNdhemi and NMNdhomo DRG cultures. (B) Quantification of the degeneration index in experiments described in (A) was calculated from three fields per sample in 3 independent experiments (mean ± SD; n = 3; two-way ANOVA followed by Bonferroni post-hoc test; ***p<0.001, ****p<0.0001, NS non-significant). |