
Fig. 6
- ID
- ZDB-FIG-170505-17
- Publication
- Di Stefano et al., 2017 - NMN Deamidase Delays Wallerian Degeneration and Rescues Axonal Defects Caused by NMNAT2 Deficiency In Vivo
- Other Figures
- All Figure Page
- Back to All Figure Page
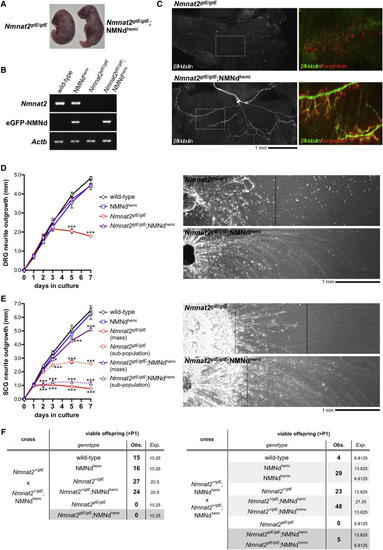
Expression of NMN Deamidase Rescues Axon Defects in Mice Lacking NMNAT2 (A) Representative gross morphology of newborn Nmnat2gtE/gtE and Nmnat2gtE/gtE;NMNdhemi pups. (B) RT-PCR analysis of Nmnat2, eGFP-NMN deamidase, and Actb (sample control) mRNA in E18.5 brain from embryos of the indicated genotypes (images representative of n = 3). (C) βIII-tubulin immunostaining (left-hand images) revealing the presence of phrenic nerve terminal branches in a Nmnat2gtE/gtE;NMNdhemi diaphragm. These are invariantly absent from Nmnat2gtE/gtE diaphragms. Boxed regions are magnified (right). Acetylcholine receptor (AChR) clusters are labeled by counter-staining with bungarotoxin-TRITC. Innervation of AChR clusters is only evident in the Nmnat2gtE/gtE;NMNdhemi diaphragm (images representative of n = 3 Nmnat2gtE/gtE and n = 5 Nmnat2gtE/gtE;NMNdhemi diaphragms). Innervation in Nmnat2gtE/gtE;NMNdhemi diaphragms is superficially similar to that in wild-type and NMNdhemi controls (data not shown). (D and E) Radial neurite outgrowth from DRG explants (D) and radial neurite outgrowth from SCG explants (E). Ganglia were taken from E18.5 embryos of the genotypes listed and outgrowth followed over 7 days in culture (mean radial extension in mm ± SEM; average of two ganglia per embryo for n = 3–5 embryos per genotype; two-way repeated-measures ANOVA with Dunnett’s multiple comparisons post hoc tests of wild-type versus other groups, ∗p < 0.05 and ∗∗∗p < 0.001). Representative images of neurite outgrowth at 7 days for Nmnat2gtE/gtE and Nmnat2gtE/gtE;NMNdhemi DRG (D) and SCG (E) cultures are shown to the right of each graph in each panel. Nmnat2gtE/gtE;NMNdhemi DRG and SCG neurite outgrowth (from ganglia positioned on the left) extends beyond the right-hand edge of the images. Two populations of neurites can be differentiated in Nmnat2gtE/gtE and Nmnat2gtE/gtE;NMNdhemi SCG cultures (E); most Nmnat2gtE/gtE neurites show severely retarded outgrowth (mass, solid line), with a subpopulation extending further (dashed line); most Nmnat2gtE/gtE;NMNdhemi neurites instead show near-normal outgrowth (mass, solid line), while a subpopulation shows severely limited outgrowth (dashed line). (F) Viability past post-natal day 1 (P1) for offspring from Nmnat2+/gtE × Nmnat2+/gtE;NMNdhemi and Nmnat2+/gtE;NMNdhemi × Nmnat2+/gtE;NMNdhemi matings. |