
|
Fig. 3
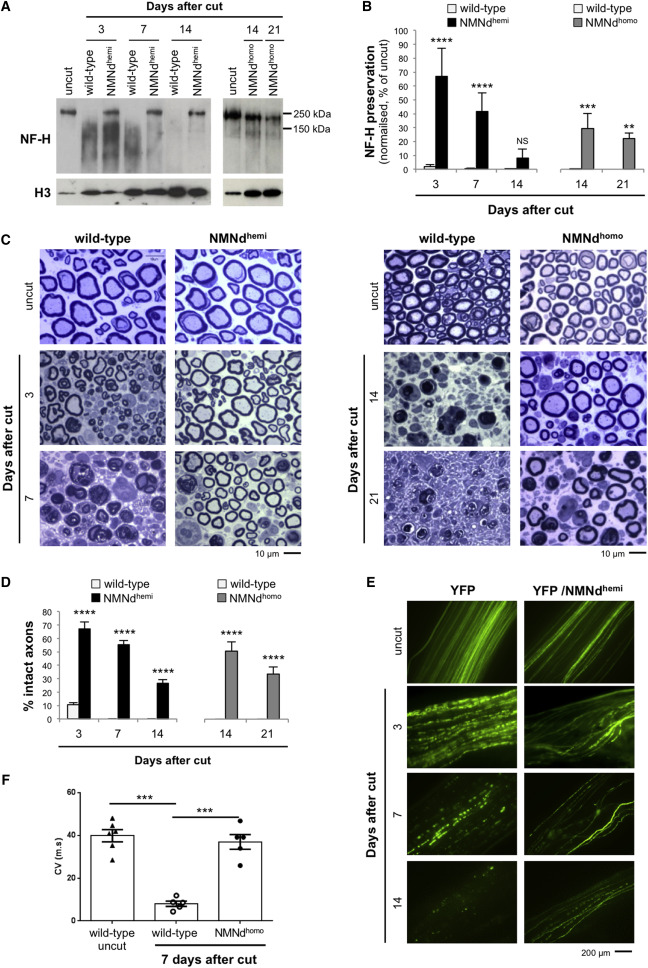
NMN Deamidase Expression Confers Morphological and Functional Preservation of Transected Axons
(A) Western blot showing reduced neurofilament heavy chain (NF-H) degradation in tibial nerve at the indicated times after sciatic nerve transection. Degradation is delayed in NMNdhemi and NMNdhomo mice compared to wild-type controls.
(B) Quantification of NF-H band intensity after normalization to histone 3 (H3) in wild-type, NMNdhemi, and NMNdhomo mice. Less nerve lysate from uncut nerve was used per lane to avoid overloading and progressively higher amounts loaded for cut nerves (as degeneration increased) to better visualize the intact NF-H and smear of degradation products. We corrected for this by normalizing to the loading control band and expressing values as a percentage of the normalized value in uncut nerve (mean ± SD; n = 3–4; two-way ANOVA followed by Bonferroni post hoc test, ∗∗p < 0.01, ∗∗∗p < 0.001, and ∗∗∗∗p < 0.0001; NS, non-significant).
(C and D) Light microscopy images of sciatic nerves from wild-type, NMNdhemi, and NMNdhomo mice at the indicated time points after cut (C) and quantification of the percentage of intact axons (D) (mean ± SD; n = 3; two-way ANOVA followed by Bonferroni post hoc test, ∗∗∗∗p < 0.0001).
(E) Fluorescent images of sciatic nerves from YFP and YFP/NMNdhemi mice at the indicated time points after cut. Axon continuity is better preserved in the NMN deamidase-expressing axons.
(F) Conduction velocities measured in uncut nerves or 7 days after cut via stimulation of sciatic nerve to evoke electromyographic activity (mean ± SEM; n = 5–6; one-way ANOVA, ∗∗∗p < 0.001). See also Figure S1.