
- Title
-
Neural Crest Migration and Survival Are Susceptible to Morpholino-Induced Artifacts
- Authors
- Boer, E.F., Jette, C.A., Stewart, R.A.
- Source
- Full text @ PLoS One
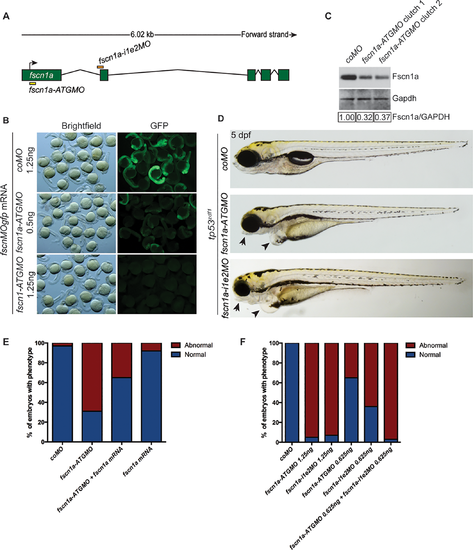
Analysis of a translation-blocking fscn1a morpholino. (A) Schematic of fscn1a genomic locus. Binding sites for translation-blocking fscn1a-ATGMO and splice-blocking fscn1a-i1e2MO are depicted. Arrow indicates translation start site. (B) Bright-field and fluorescent images of 24 hpf tp53zdf1 mutant embryos injected with the indicated amount of fscnMOgfp mRNA and coMO or fscn1a-ATGMO. (C) Immunoblot showing Fscn1a protein levels in 48 hpf tp53zdf1 embryos injected with 1.25 ng of coMO or fscn1a-ATGMO. Values below the blot represent relative band intensity of Fscn1a/GAPDH normalized to coMO sample. (D) Representative bright-field images of 5 dpf tp53zdf1 mutant embryos injected with 1.25 ng of the indicated MOs. Fscn1a morphants show loss of tissue associated with the lower jaw as well as cardiac edema (arrows highlight both phenotypes). (E) tp53zdf1 embryos were injected with the indicated MO and analyzed at 5 dpf for craniofacial morphology. (F) tp53zdf1 embryos were injected with the indicated MO (1.25 ng) and/or mRNA (25 pg) and analyzed at 5 dpf for craniofacial morphology. All experiments in this figure were performed independently at least three times with similar results. |
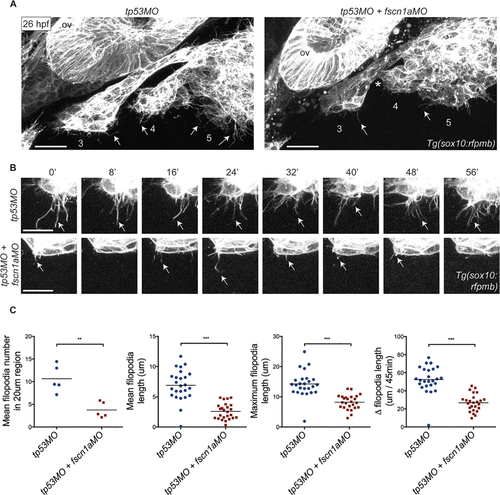
fscn1aMO reduces NC-cell filopodia formation. (A) Lateral views of posterior cranial NC streams in 26 hpf Tg(sox10:rfpmb) embryos injected with tp53MO or tp53MO plus fscn1aMO. Numbers correspond to NC streams. Arrows denote filopodia at leading edge of NC streams. Arrowheads mark RFP-positive puncta surrounding NC streams. Asterisk highlights fusion of NC streams 3 and 4 in fscn1a-morphant embryo. ov; otic vesicle. Scale bar = 50μm. (B) Time-lapse confocal images of filopodia at leading edge of NC stream 3 in 26 hpf Tg(sox10:rfpmb) embryos injected with tp53MO or tp53MO plus fscn1aMO. Arrows mark tips of single filopodia throughout the time lapse. Scale bar = 10 μm. (C) Quantitation of mean filopodia number in 20 μm region at leading edge of NC stream 3, mean filopodia length, maximum filopodia length, and change in filopodia length over 45 minutes in 26 hpf Tg(sox10:rfpmb) embryos injected with tp53MO or tp53MO plus fscn1aMO (n = 5 embryos and 25 filopodia for each condition, **p<0.005, ***p<0.001 by an unpaired t-test analysis). In all panels, anterior is to the left. At least three independent experiments were performed in this figure with similar results. |
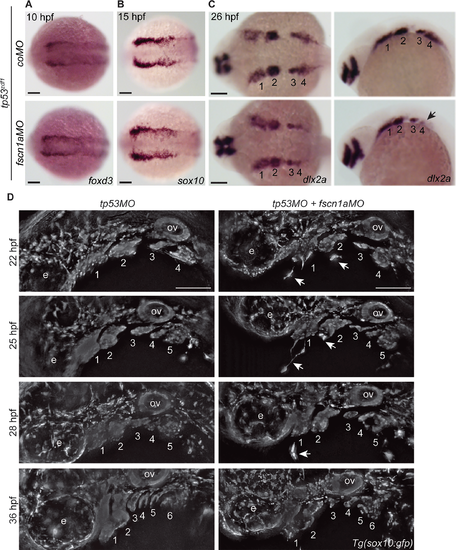
Late-stage NC-cell migration is disrupted in fscn1a-morphant embryos. (A-B) Dorsal cranial views of tp53zdf1 embryos injected with coMO or fscn1aMO and analyzed by whole-mount in situ hybridization (ISH) for (A) foxd3 mRNA at 10 hpf and (B) sox10 mRNA at 15 hpf. (C) Dorsal cranial and lateral views of 26 hpf tp53zdf1 embryos injected with coMO or fscn1aMO and analyzed by whole-mount ISH for dlx2a. Numbers correspond to pharyngeal arches. Arrow denotes reduction in dlx2a-positive cranial NC cells in fscn1a morphants. (D) Lateral views of cranial NC streams in 22, 25, 28 and 36 hpf Tg(sox10:gfp) embryos injected with tp53MO or tp53MO plus fscn1aMO. Numbers correspond to NC streams. Arrows highlight NC cells migrating independently of NC streams in fscn1a morphants. e; eye, ov; otic vesicle. In all panels, anterior is to the left. All experiments in this figure were performed independently at least three times with similar results. All scale bars in this figure = 100 μm. EXPRESSION / LABELING:
PHENOTYPE:
|
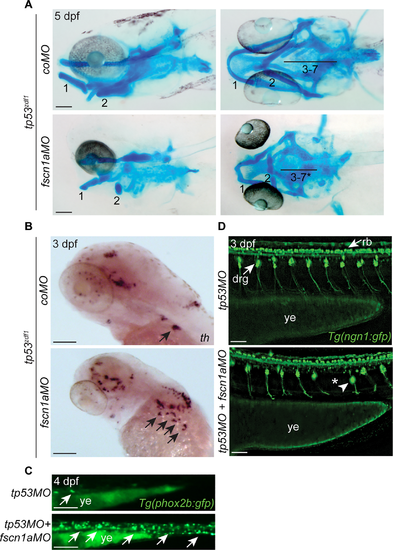
NC-derived tissues form abnormally in fscn1a-morphant embryos. (A) Lateral and ventral views of 5 dpf tp53zdf1 embryos injected with coMO or fscn1aMO and stained with Alcian blue. Numbers correspond to pharyngeal arches. Asterisk denotes arches that are severely reduced in size or absent. (B) Lateral views of 3 dpf tp53zdf1 embryos analyzed by whole-mount ISH for th. Arrows denote th-positive neurons of sympathetic ganglia. (C) Lateral views of section of the gut in 4 dpf Tg(phox2b:gfp) embryos injected with tp53MO or tp53MO plus fscn1aMO. Arrows denote phox2b-positive enteric neurons. (D) Lateral views of trunk in 3 dpf Tg(ngn1:gfp) embryos injected with tp53MO or tp53MO plus fscn1aMO. Arrows in top panel highlight ngn1-positive NC-derived dorsal root ganglia (drg) and central nervous system (CNS)-derived Rohon-Beard neurons (rb). In lower panel, arrowhead and asterisk indicate misplaced and absent dorsal root ganglia, respectively. drg; dorsal root ganglia, rb; Rohan-Beard neurons, ye; yolk extension. In all panels, anterior is to the left. All experiments in this figure were performed independently at least three times with similar results. All scale bars in this figure = 100 μm. EXPRESSION / LABELING:
PHENOTYPE:
|
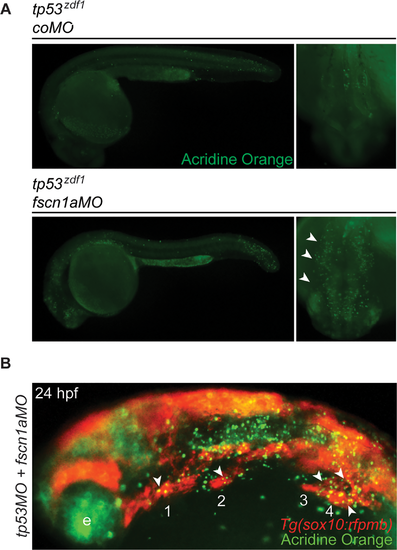
Fscn1aMO induced tp53-independent cell death in NC cells. (A) Lateral and dorsal cranial views of 28 hpf tp53zdf1 mutant embryos injected with coMO or fscn1aMO and stained with AO. Arrowheads highlight AO-positive cells adjacent to neural tube. (B) Lateral view of 24 hpf Tg(sox10:rfpmb) embryo injected with tp53MO plus fscn1aMO and stained with AO. Numbers correspond to NC streams. Arrows indicate regions of RFP-positive/AO-positive cells. e; eye, nt; neural tube. In all lateral views or dorsal cranial views, anterior is to the left or bottom, respectively. Experiments in this figure were performed independently at least three times with similar results. |
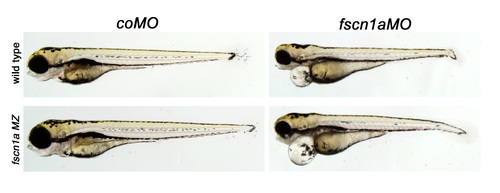
Lateral views of 4 dpf wild-type (top panels) and fscn1a MZ (bottom panels) embryos injected with coMO or fscn1aMO as indicated. The fscn1aMO causes severe morphological defects in both wild-type and fscn1a MZ embryos, indicating that compensatory genetic pathways are not activated in fscn1a null mutants. All experiments in this figure were performed independently at least two times with similar results (n = 50 embryos/condition). |
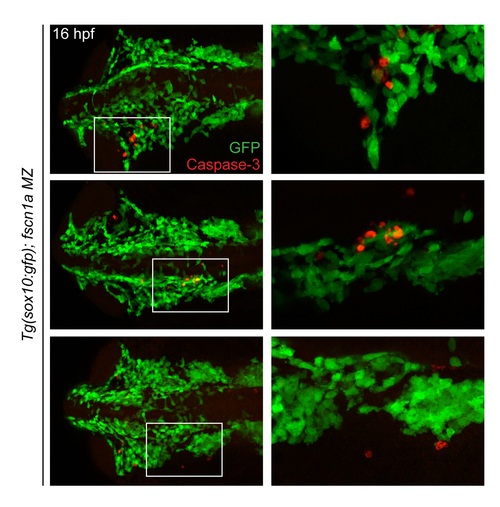
Cell death is minimal in fscn1a MZ cranial NC streams. Dorsal cranial views of 16 hpf Tg(sox10:gfp); fscn1a MZ embryos stained for GFP and activated Caspase-3. Boxed region in left panels is magnified in right panels. In all panels, anterior is to the left. |
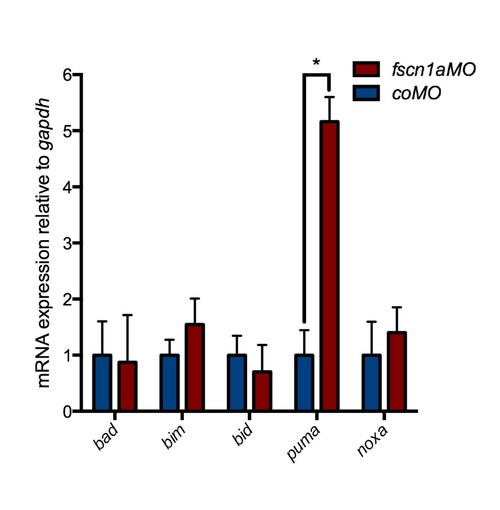
Upregulation of puma in tp53 mutant embryos injected with fscn1aMO. Expression of bad, bim, bid, puma and noxa mRNA relative to gapdh in 24 hpf tp53M214K/M214K embryos injected with coMO or fscn1aMO. Error bars represent the standard error of the mean (SEM) from three independent experiments, *p = 0.0057. |