
Fig. 1
- ID
- ZDB-FIG-171006-23
- Publication
- Boer et al., 2016 - Neural Crest Migration and Survival Are Susceptible to Morpholino-Induced Artifacts
- Other Figures
- All Figure Page
- Back to All Figure Page
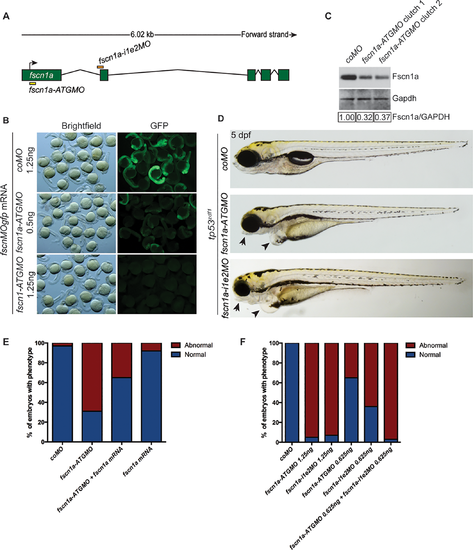
Analysis of a translation-blocking fscn1a morpholino. (A) Schematic of fscn1a genomic locus. Binding sites for translation-blocking fscn1a-ATGMO and splice-blocking fscn1a-i1e2MO are depicted. Arrow indicates translation start site. (B) Bright-field and fluorescent images of 24 hpf tp53zdf1 mutant embryos injected with the indicated amount of fscnMOgfp mRNA and coMO or fscn1a-ATGMO. (C) Immunoblot showing Fscn1a protein levels in 48 hpf tp53zdf1 embryos injected with 1.25 ng of coMO or fscn1a-ATGMO. Values below the blot represent relative band intensity of Fscn1a/GAPDH normalized to coMO sample. (D) Representative bright-field images of 5 dpf tp53zdf1 mutant embryos injected with 1.25 ng of the indicated MOs. Fscn1a morphants show loss of tissue associated with the lower jaw as well as cardiac edema (arrows highlight both phenotypes). (E) tp53zdf1 embryos were injected with the indicated MO and analyzed at 5 dpf for craniofacial morphology. (F) tp53zdf1 embryos were injected with the indicated MO (1.25 ng) and/or mRNA (25 pg) and analyzed at 5 dpf for craniofacial morphology. All experiments in this figure were performed independently at least three times with similar results. |
| Antibody: | |
|---|---|
| Fish: | |
| Knockdown Reagent: | |
| Anatomical Term: | |
| Stage: | Long-pec |
| Fish: | |
|---|---|
| Knockdown Reagents: | |
| Observed In: | |
| Stage Range: | Long-pec to Day 5 |