
- Title
-
klf2a couples mechanotransduction and zebrafish valve morphogenesis through fibronectin synthesis
- Authors
- Steed, E., Faggianelli, N., Roth, S., Ramspacher, C., Concordet, J.P., Vermot, J.
- Source
- Full text @ Nat. Commun.
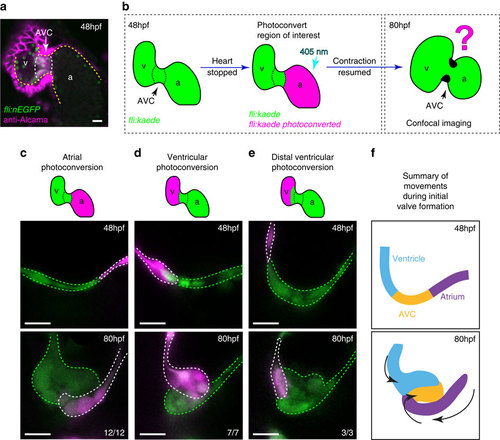
The cellular contribution of heart chambers to emerging valve leaflets. (a) anti-Alcama immunofluorescence analysis shows Alcama-positive EdCs in the AVC of fli:nEGFP hearts (white dotted line), used to define the cardiac chambers at 48 hpf. Yellow dashed line delineates the endocardium from the myocardium, which also stains positively for Alcama. v=ventricle, a=atrium, AVC=atrioventricular canal. (b) The experimental set-up for the photoconversion studies. Heart contraction was stopped in fli:kaede embryos at 48 hpf, the region of interest exposed to 405 nm light to convert kaede from a green to red (shown here to be the atrium, in magenta) fluorescent form and heart contraction was then resumed until 80 hpf. Stopped hearts were imaged at 80 hpf by confocal microscopy. (c) EdCs present in the atrium and Alcama-negative at 48 hpf lined the lumen of the AVC at 80 hpf (n=12/12, 3 experiments), while those in the ventricle contribute cells to the cardiac jelly (d; n=7/7, 3 experiments). Ventricular cells outside the ventricular inner curvature (distal ventricle) do not enter the cardiac jelly at 80 hpf (e; n=3/3, 2 experiments). In all cases only the superior valve leaflet is shown. (f) Schematic representation of the cellular contributions of each chamber to the emerging valve leaflet at 80 hpf. Atrial cells (purple) line the lumen of the AVC, while EdCs originating in the ventricular inner curvature (blue) and AVC (yellow) contribute cells to the cardiac jelly. Black arrows highlight the coordinated movements of the groups of cells. Scale bars, 10 µm. EXPRESSION / LABELING:
|
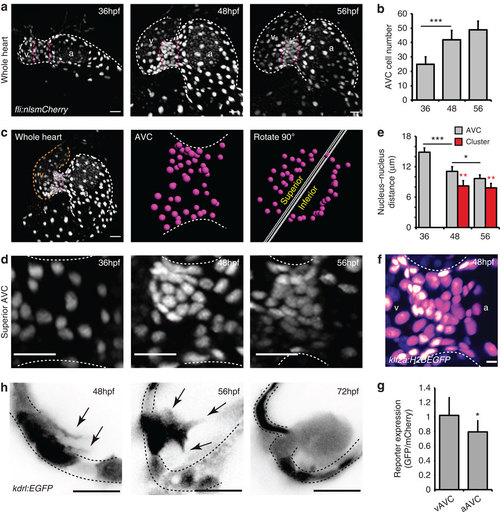
EdCs move into the cardiac jelly from a region of increased cell density. (a) fli:nlsmCherry hearts imaged at early stages of heart development show the organization of EdCs between 36 and 56 hpf. White dotted lines outline the endocardium. Magenta dotted lines mark the AVC. (b) Total AVC cell number quantification at 36, 48 and 56 hpf. (c) Demonstration of how the superior AVC is defined and presented in d: The nuclei of AVC EdCs are defined (magenta spots) from images of the whole heart (orange/v= ventricle; white/a=atrium), rotated 90 °C using Imaris software and then divided into two parts, the superior AVC (to be the upper leaflet) and the inferior AVC (to be the lower leaflet). Orthogonal views of the superior AVC are then shown to display nuclei organization in d. (d) Regional increases in cell density can be seen on the ventricular side of the AVC from 48 hpf (n=5 at each developmental stage). (e) Quantification of nucleus-nucleus distances within the AVC shows enhanced proximity of nuclei within the cluster region. No red bar at 36 hpf signifies the absence of a cluster at this stage. (f) klf2a expression pattern in the whole AVC at 48 hpf in the klf2a:H2BEGFP transgenic line shows enrichment of GFP signal on the ventricular side. The GFP signal is shown as FireLUT to aid visualization (white=highest intensity, black=no signal). (g) Relative reporter expression level in the ventricular (vAVC) and atrial (aAVC) regions of the AVC (n=10). (h) Imaging of kdrl:EGFP hearts demonstrates the presence of protrusions (black arrows) extending from the region of clustered cells towards the cardiac jelly at 48 hpf. Cells emanating into the cardiac jelly can be seen from 56 hpf. Protrusions are also still visible (black arrows). Groups of cells are present in the cardiac jelly by 72 hpf. Inverted images of the kdrl:EGFP signal are shown to aid visualization of the protrusive structures. Black dotted lines mark the EdCs layer. Error bars in all graphs represent the s.d. Student’s t-test ***P<0.005, **P<0.01, *P<0.05. Scale bars, 10 µm; except in f: 2 µm. EXPRESSION / LABELING:
|
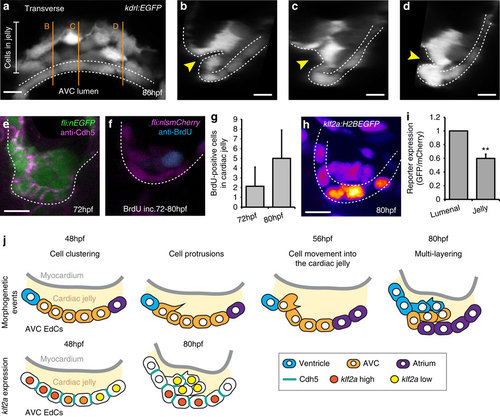
EdCs display distinct characteristics inside the cardiac jelly. (a) Transverse section of a kdrl:EGFP AVC at 80 hpf shows distinctive cell shapes within the AVC. Cells in the cardiac jelly have a mesenchymal morphology compared with those lining the lumen (enclosed in white dotted lines). Orange lines mark the positions of images i-iii. (b-d) white dotted line outlines the luminal EdCs and the yellow arrowheads highlight the deformation of the ventricular wall towards the cardiac jelly. The protrusive morphology of the cells within the cardiac jelly can also be observed. (e) Immunofluorescence analysis shows downregulation of Cdh5 between EdCs in the cardiac jelly (n=9). (f) anti-BrdU immunofluorescence following BrdU incubation between 72-80 hpf shows a BrdU-positive cell in the cardiac jelly. Shown is a single z slice. (g) Quantification of total numbers of BrdU-positive cells in the cardiac jelly at 72 hpf (BrdU incubation=56-72 hpf; n=7) and 80 hpf (BrdU incubation=72-80 hpf; n=5) (h) Imaging of the klf2a:H2BEGFP reporter line shows the klf2a expression pattern in the AVC at 80 hpf (GFP signal shown as FireLUT). (i) Normalized relative reporter expression levels in the EdCs exposed to the AVC lumen (lumenal) and those inside the cardiac jelly (jelly) (all cells in the superior AVC analysed from three embryos). Error bar represents the standard deviation. **P<0.01. (j) Model of the early stages of AVV formation. In the first series, cells are colour-coded to describe the morphogenetic events occurring during valve formation. Cells originating in the atrium (purple), AVC (yellow) and ventricle (blue) at 48 hpf and their relative positions at 80 hpf are shown. In the second series, Cdh5 and klf2a levels within the AVC are represented for the time points assessed. The myocardium is shown in grey and the cardiac jelly in pale yellow. Descriptions of the key stages at the relevant developmental time points are noted. Student’s t-test ***P<0.005, **P<0.01, *P<0.05. Scale bars, 10 µm. EXPRESSION / LABELING:
|
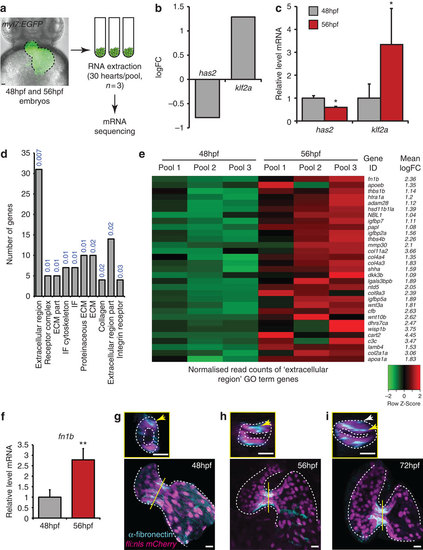
Transcriptome analysis identifies increased ECM protein gene expression during initial stages of valve formation. (a) Experimental set-up for mRNA sequencing. RNA was extracted from hearts of myl7:EGFP embryos dissected at 48 and 56 hpf, in pools of 30 (n=3). (b) Downregulation of has2 and upregulation of klf2a transcripts, confirmed by qPCR (c), validated our approach. (d) Gene Ontology (GO) analysis based on cellular compartment terms of upregulated genes highlighted a significant enrichment of ECM-related terms. P values describing the significance of each term enrichment are shown in blue. (e) Specific analysis of the most significantly enriched group (the ‘extracellular region’ term), highlighting, among others, elevated fibronectin1b expression between 48 and 56 hpf. (f) qPCR analysis of heart RNA confirms an increase in fn1b transcript levels between 48 and 56 hpf. (g-i) Immunofluorescence analysis shows fibronectin synthesis is localized to the AVC during early stages of valve formation (n=8 (48 hpf), n=11 (56 hpf) and n=7 (72 hpf)). Yellow lines mark the position of the transverse sections shown in small panels. Yellow arrows highlight enriched fibronectin-positive staining in the superior AVC. White arrow in small panel (i) points to fibronectin deposition on multiple cell layers. Student’s t-test ***P<0.005, **P<0.01, *P<0.05. Scale bars, 10 µm. EXPRESSION / LABELING:
|
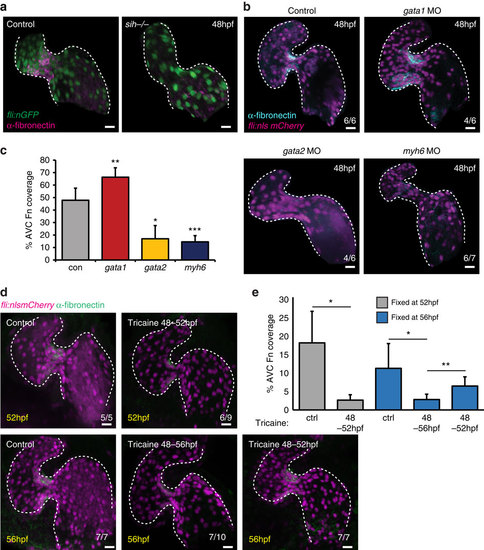
AVC-specific fibronectin synthesis is dependent on blood flow forces. (a) Fibronectin staining (magenta) is lost in the absence of heart contraction (fli:nEGFP, sih-/- embryos) (n=6/6). (b) fli:nlsmCherry embryos injected with gata1, gata2 or myh6 morpholinos to alter blood flow forces were fixed at 48 hpf and anti-fibronectin immunofluorescence analysis was performed. Alterations in flow forces impacted fibronectin synthesis (cyan) in the AVC of gata1, gata2 or myh6 morphants. (c) Quantification of extent of fibronectin (Fn)-positive staining confirms an increase in gata1 morphants and a reduction in both gata2 and myh6 morphants. (d) fli:nlsmCherry (magenta) embryos were incubated with 0.1% tricaine between 48-52 and 48-56 hpf to stop heart contraction. When necessary, heart contraction was restored at 52 hpf by washing out tricaine and embryos were left to develop under normal conditions until 56 hpf. Yellow font shows embryonic age at fixation. Anti-fibronectin immunofluorescence (green) shows the flow-responsive nature of fibronectin in the AVC. (e) Quantification of extent of fibronectin-positive staining confirms the restoration of fibronectin synthesis following restoration of heart contraction. Control (ctrl) samples were not incubated in 0.1% tricaine. Student’s t-test ***P<0.005, **P<0.01, *P<0.05. Scale bars, 10 µm. |
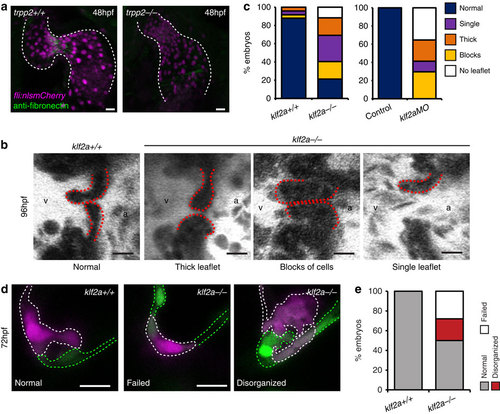
Characterization of klf2a-/- mutants. (a) anti-fibronectin staining (green) is reduced in the AVC of trpp2-/- mutants (12/12 trpp2+/+, 9/19 trpp2-/-). (b,c) A range of valvular defects were observed in klf2a-/- mutant embryos at 96 hpf (n=25 klf2a+/+, n=48 klf2a-/-), similar to those observed in klf2aMO-injected embryos (e; n=20 control, n=17 klf2aMO). (d) Photoconversion of AVC EdCs at 48 hpf shows the organization of cells within the cardiac jelly to be affected by loss of klf2a (d,e; n=21 klf2+/+, n=32 klf2a-/-) at 72 hpf. Scale bars, 10 µm. EXPRESSION / LABELING:
|
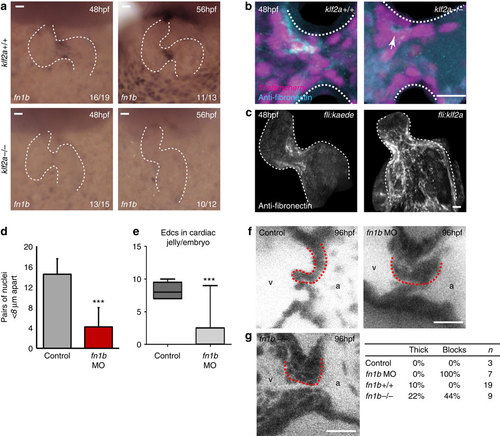
Klf2a expression regulates fibronectin synthesis in the AVC to drive valve formation. (a) in situ hybridization analysis shows the fn1b mRNA expression in the AVC of klf2a+/+ embryos, at 48 and 56 hpf, is lost in the majority of klf2a-/- embryos. (b) Immunofluorescence analysis shows reduced fibronectin-positive staining (cyan) in the AVC of klf2a-/- mutants (n=12 klf2+/+, n=18 klf2a-/-). A z-projection of the whole AVC is shown. (c) Forced expression of Klf2a in EdCs using the Tg(fli:gal4FFubs; UAS:klf2a) line results in fibronectin-positive staining in the atrium and ventricle (n=12/16) compared with the AVC-specific staining pattern in controls (n=12/14) in at least three independent experiments. A z-projection of the whole heart is shown. (d) Analysis of fn1b morphants showed defective cell clustering in the superior AVC at 48 hpf (control n=6, fn1bMO n=5) and (e) reduced numbers of nuclei in the cardiac jelly at 72 hpf (control n=5, fn1bMO n=9). (f) Live imaging of valves at 96 hpf showed leaflets fail to form in fn1b morphants (controls n=3, fn1bMO n=7). Single frames from the live imaging are shown and red dotted lines outline the superior valve leaflet in each case. The ventricle (v) and atrium (a) are labelled for orientation. (g) Single frames from the live imaging of fn1b-/- mutant hearts, quantification of the percentage of thick/blocked valves observed in fn1b MO, fn1b-/- mutant hearts and their respective controls. Student’s t-test ***P<0.005, **P<0.01, *P<0.05. Scale bars, 10 µm. |

Contribution of atrial and ventricular cells to the AV valve leaflets at later stages. Endocardial cells of the atrium or ventricle were photoconverted at 48hpf as shown, and then allowed to develop normally. Hearts were briefly stopped for imaging at 120hpf and 168hpf. No mixing of atrial and ventricular cells was observed in the superior valve leaflet at these later stages. Atrial cells lined the atrial side of the valve leaflet at 120hpf and 168hpf, and ventricular cells lined the ventricular side. Images shown are from the same hearts at 48hpf, 120hpf and 168hpf. White-dotted lines mark the cells containing photoconverted kaede (magenta). Green-dotted lines mark the cells containing nonphotoconverted kaede (green). Scale bars: 10 µm. |
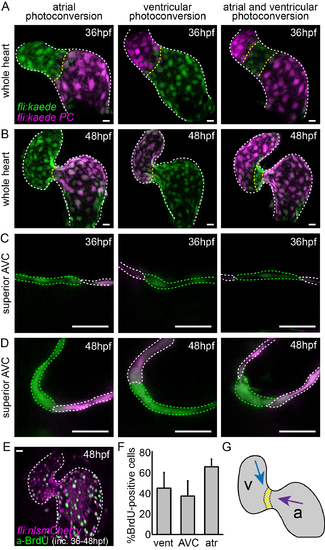
Cell movements and proliferation may contribute to increased AVC cell density at 48hpf. (A) Kaede-expressing cells in the atrium, ventricle, or both at 36hpf were photoconverted (photoconverted = magenta; non-photoconverted = green) and the hearts were allowed to develop normally until 48hpf. (B) Imaging stopped hearts at 48hpf showed photoconverted cells of the atrium to be in the AVC at 48hpf. Cells of the ventricle are present in the ventricular inner curvature at 48hpf. (E) Incubation of embryos with BrdU between 36hpf and 48hpf followed by anti-BrdU immunofluorescence analysis demonstrated the presence of BrdU-positive cells (green) in both chambers of the heart. (F) Quantification of BrdU-positive cells in the ventricle, AVC and atrium (n=8). (G) Representation of the movement of cells from the atrium (purple arrow) and the ventricle (blue arrow) between 36hpf and 48hpf. The yellow region represents cells from the AVC of the 36hpf heart, which cluster together on the ventricular side of the AVC at 48hpf. Error bar represents the standard deviation. Scale bars: 10 µm. |
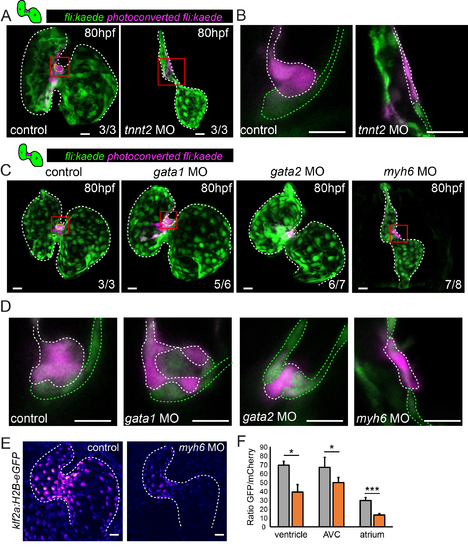
Defects in multi-layering occur in the presence of abnormal flow. Cells in the superior AVC of Tg(fli:kaede) embryos injected as shown were photoconverted in the superior AVC (schematic shown) at 48hpf and allowed to develop until 80hpf in all panels. (A) In tnnt2aMO-injected hearts, lacking heart contraction, multi-layering failed to occur by 80hpf (n=3 control, n=3 tnnt2aMO). Boxed red areas in (A) are shown in (B). Photoconverted cells remained in the single-layered endocardium. White dashed line highlights the photoconverted cells of the superior AVC. (C) Many cells were observed in the cardiac jelly of gata1MO-injected hearts (yellow dashed line highlights cells in the cardiac jelly) and intermingling of non-photoconverted (green) and photoconverted (magenta) cells was sometimes observed (n=3/6) (D). Boxed red areas from (C) are shown in (D). In contrast, multi-layering was impaired in gata2MO-injected and failed to occur in myh6 MOinjected embryos. n=3 control, n=6 gata1MO, n=7 gata2MO, n=8 myh6 MO. Green dashed line highlights the non-photoconverted cells of the superior AVC. (E and F) Quantification of GFP signal intensity in klf2a:H2B-eGFP embryos demonstrates reduced klf2a expression in myh6 MO hearts (n=4 control hearts, n=3 myh6MO hearts). Error bar represents the standard deviation. Scale bars: 10 µm. |
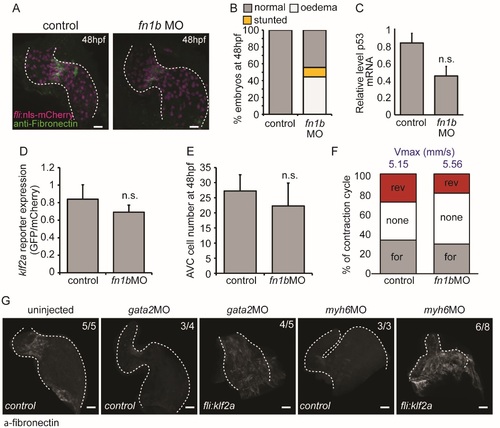
Characterisation of fn1bMO-injected embryos. (A) Immunofluorescence analysis shows reduced Fibronectin-positive staining (green) in the AVC of fli:nlsmCherry embryos injected with fn1bMO at 48 hpf (n=5 control, n=5 fn1bMO). (B) Quantification of overall morphological defects after fn1bMO injection (n=279 control, n=286 fn1bMO). (C) RT-qPCR analysis shows no significant increase in p53 expression following injection of fn1bbMO compared to controls (RNA extracted from 3 pools of 20 embryos). (D) Relative klf2a expression in klf2a:H2BEGFP embryos and (E) cell numbers at 48hpf are not affected by injection of fn1bMO (n=4 control, n=7 fn1bMO). (F) The flow profile was assessed by tracking red blood cells through the AVC in 3 consecutive heartbeats in control and fn1bMO embryos. The average proportion of forward (for), reversing (rev) and no flow (none) within the AVC is shown (n=2 and 3 embryos, respectively). The average maximum velocity (Vmax) in mm/s is also shown (blue text). (G) fli:kaede (control) and fli:klf2a embryos injected with gata2 and myh6 morpholinos were immunostained with antifibronectin antibody. Fibronectin synthesis can be seen throughout the heart in gata2 and myh6 morphants overexpressing klf2a. Error bar represents the standard deviation. Scale bars: 10 µm. |