
Fig. 3
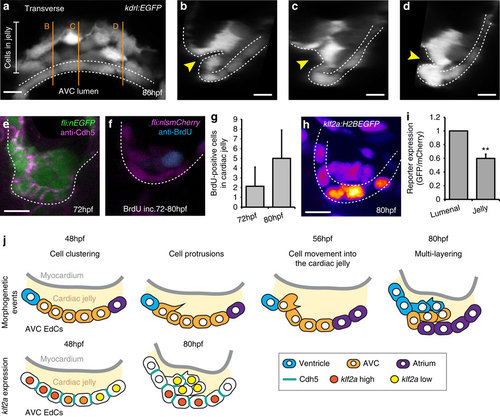
EdCs display distinct characteristics inside the cardiac jelly. (a) Transverse section of a kdrl:EGFP AVC at 80 hpf shows distinctive cell shapes within the AVC. Cells in the cardiac jelly have a mesenchymal morphology compared with those lining the lumen (enclosed in white dotted lines). Orange lines mark the positions of images i-iii. (b-d) white dotted line outlines the luminal EdCs and the yellow arrowheads highlight the deformation of the ventricular wall towards the cardiac jelly. The protrusive morphology of the cells within the cardiac jelly can also be observed. (e) Immunofluorescence analysis shows downregulation of Cdh5 between EdCs in the cardiac jelly (n=9). (f) anti-BrdU immunofluorescence following BrdU incubation between 72-80 hpf shows a BrdU-positive cell in the cardiac jelly. Shown is a single z slice. (g) Quantification of total numbers of BrdU-positive cells in the cardiac jelly at 72 hpf (BrdU incubation=56-72 hpf; n=7) and 80 hpf (BrdU incubation=72-80 hpf; n=5) (h) Imaging of the klf2a:H2BEGFP reporter line shows the klf2a expression pattern in the AVC at 80 hpf (GFP signal shown as FireLUT). (i) Normalized relative reporter expression levels in the EdCs exposed to the AVC lumen (lumenal) and those inside the cardiac jelly (jelly) (all cells in the superior AVC analysed from three embryos). Error bar represents the standard deviation. **P<0.01. (j) Model of the early stages of AVV formation. In the first series, cells are colour-coded to describe the morphogenetic events occurring during valve formation. Cells originating in the atrium (purple), AVC (yellow) and ventricle (blue) at 48 hpf and their relative positions at 80 hpf are shown. In the second series, Cdh5 and klf2a levels within the AVC are represented for the time points assessed. The myocardium is shown in grey and the cardiac jelly in pale yellow. Descriptions of the key stages at the relevant developmental time points are noted. Student’s t-test ***P<0.005, **P<0.01, *P<0.05. Scale bars, 10 µm. |
| Genes: | |
|---|---|
| Fish: | |
| Anatomical Terms: | |
| Stage: | Protruding-mouth |