
Fig. 2
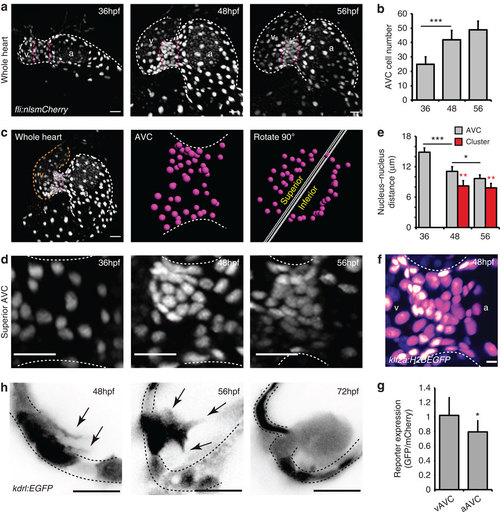
EdCs move into the cardiac jelly from a region of increased cell density. (a) fli:nlsmCherry hearts imaged at early stages of heart development show the organization of EdCs between 36 and 56 hpf. White dotted lines outline the endocardium. Magenta dotted lines mark the AVC. (b) Total AVC cell number quantification at 36, 48 and 56 hpf. (c) Demonstration of how the superior AVC is defined and presented in d: The nuclei of AVC EdCs are defined (magenta spots) from images of the whole heart (orange/v= ventricle; white/a=atrium), rotated 90 °C using Imaris software and then divided into two parts, the superior AVC (to be the upper leaflet) and the inferior AVC (to be the lower leaflet). Orthogonal views of the superior AVC are then shown to display nuclei organization in d. (d) Regional increases in cell density can be seen on the ventricular side of the AVC from 48 hpf (n=5 at each developmental stage). (e) Quantification of nucleus-nucleus distances within the AVC shows enhanced proximity of nuclei within the cluster region. No red bar at 36 hpf signifies the absence of a cluster at this stage. (f) klf2a expression pattern in the whole AVC at 48 hpf in the klf2a:H2BEGFP transgenic line shows enrichment of GFP signal on the ventricular side. The GFP signal is shown as FireLUT to aid visualization (white=highest intensity, black=no signal). (g) Relative reporter expression level in the ventricular (vAVC) and atrial (aAVC) regions of the AVC (n=10). (h) Imaging of kdrl:EGFP hearts demonstrates the presence of protrusions (black arrows) extending from the region of clustered cells towards the cardiac jelly at 48 hpf. Cells emanating into the cardiac jelly can be seen from 56 hpf. Protrusions are also still visible (black arrows). Groups of cells are present in the cardiac jelly by 72 hpf. Inverted images of the kdrl:EGFP signal are shown to aid visualization of the protrusive structures. Black dotted lines mark the EdCs layer. Error bars in all graphs represent the s.d. Student’s t-test ***P<0.005, **P<0.01, *P<0.05. Scale bars, 10 µm; except in f: 2 µm. |
| Genes: | |
|---|---|
| Fish: | |
| Anatomical Terms: | |
| Stage Range: | Prim-25 to Protruding-mouth |