
- Title
-
Vegfc Regulates Bipotential Precursor Division and Prox1 Expression to Promote Lymphatic Identity in Zebrafish
- Authors
- Koltowska, K., Lagendijk, A.K., Pichol-Thievend, C., Fischer, J.C., Francois, M., Ober, E.A., Yap, A.S., Hogan, B.M.
- Source
- Full text @ Cell Rep.
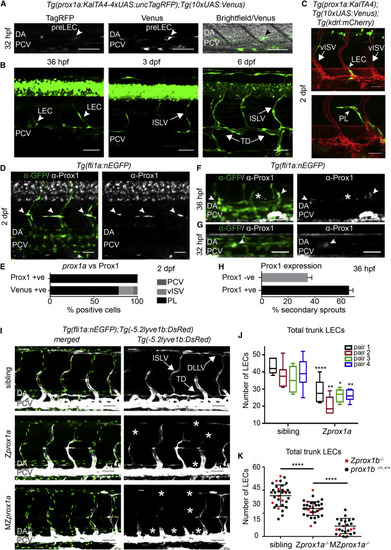
Prox1 Is Expressed and Required in Lymphatic Precursors during Secondary Sprouting (A) Single confocal projection of a TagRFP-low (left), Venus-high (middle) cell located in the wall of the PCV (bright field, right) at 32 hpf. DA, dorsal aorta; PCV, posterior cardinal vein; pre-LEC, LEC precursor (arrowheads). Scale bars, 50 µm. (B) Developmental time series of prox1a:Venus expression. PCV, posterior cardinal vein; LEC, lymphatic endothelial cell; ISLV, intersegmental lymphatic vessel; TD, thoracic duct. Scale bars, 50 µm. (C) Tg(prox1a:KALTA4);Tg(10xUAS:Venus) expression (green) in a sprouting LEC (above, arrowhead) and a parachordal lymphangioblast (PL, below, arrowhead) at 2 dpf. vISV, venous intersegmental vessel. Scale bars, 30 µm. Blood vasculature in red (Tg(kdrl:mCherry)). (D) Endogenous Prox1-positive (gray) PLs (arrowheads) in the trunk co-labeled by Tg(fli1a:nEGFP) (α-GFP, green. Scale bar, 30 µm. (E) Percentage of total prox1a:Venus- and Prox1-expressing (endogenous) cells located in the posterior cardinal vein (PCV), venous intersegmental vessels (vISV), or parachordal lymphangioblasts (PL) at 2 dpf. (F) Endogenous Prox1-positive (gray) secondary sprouts (arrowheads) and negative secondary sprouts (asterisk) at 36 hpf (Tg(fli1a:nEGFP) labeled by &alpha-GFP, green. Scale bar, 30 µm. (G) Prox1-positive (gray) nuclei located in the dorsal wall of the PCV at 32 hpf (Tg(fli1a:nEGFP) labeled by &alpha-GFP, green. Scale bar, 30 µm. (H) Mean percentage of Prox1-positive and Prox1-negative secondary sprouts per embryo at 36 hpf (Prox1 positive 65.45% ± 3.236 SEM, Prox1 negative 34.55% ± 3.236, n = 15 embryos scored across n = 6 body segments). (I) Maximum intensity projections of Tg(fli1a:nEGFP) (endothelial nuclei, green) and Tg(5.2lyve1b:DsRed) (PCV and lymphatic vessels, gray) in the trunk of sibling (top), Zprox1a (middle), and MZprox1a (bottom) mutant embryos at 4 dpf. ISLV, intersegmental lymphatic vessel; TD, thoracic duct; DLLV, dorsal longitudinal lymphatic vessel. Asterisks indicate missing lymphatic structures. Scale bar, 50 µm. (J) Box and whiskers (min to max) plot of the number of trunk lymphatic nuclei at 4 dpf in sibling and Zprox1a mutants (scored across n = 7 body segments): pair1 (n = 6 mutants, n = 10 siblings, 33% reduction), pair2 (n = 7 mutants, n = 6 siblings, 41% reduction), pair3 (n = 6 mutants, n = 4 siblings, 26% reduction), pair4 (n = 9 mutants, n = 7 siblings, 32% reduction). (K) Total number of trunk lymphatic nuclei at 4 dpf in sibling (n = 34), Zprox1a mutants (n = 32) and MZprox1a mutants (n = 24) (mean ± SEM, scored across n = 7 body segments) (t test sibling versus Zprox1ap < 0.0001 and Zprox1a versus MZprox1ap < 0.0001) (Zprox1b mutants [red], prox1b siblings [black]). |
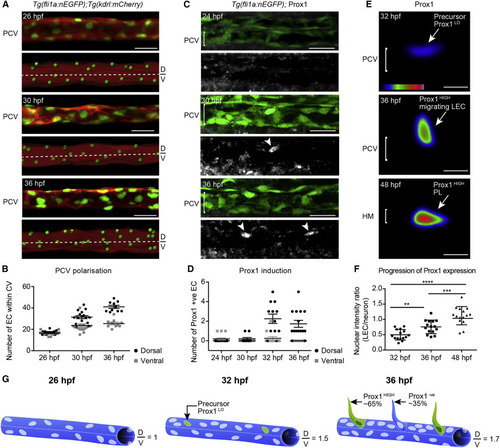
The PCV Becomes Structurally Polarized and Initiates Prox1 Expression before Secondary Angiogenesis (A) Confocal projection of Tg(fli1a:nEGFP);Tg(kdrl:mCherry) labeling endothelial cell (EC) nuclei (green) and membrane (red) showing the PCV (upper) and rendered signal (lower) at 26, 30, and 36 hpf (scored across 3 body segments). D, dorsal; V, ventral. Scale bar, 30 µm. (B) Quantification of EC number in the dorsal (black circles) and ventral (gray squares) halves of the PCV scored in lateral projections at 26 hpf (n = 10), 30 hpf (n = 16), and 36 hpf (n = 10) (scored across 3 body segments) (mean ± SEM). (C) Endogenous Prox1 (gray, lower) in the trunk vasculature of Tg(fli1a:nEGFP) embryos (α-GFP, green, top) at 24, 30, and 36 hpf (scored across 3 body segments). Scale bar, 30 µm. (D) Quantification of the number of Prox1 positive ECs in dorsal and ventral halves of the PCV at 24 hpf (n = 15), 30 hpf (n = 10), 32 hpf (n = 12), and 36 hpf (n = 12) (scored across 3 body segments) (mean ± SEM). (E) Heatmap of average intensity projection of Prox1-positive ECs at 32, 36, and 48 hpf. Scale bar, 10 µm. (F) Quantification of Prox1 protein expression intensity in Tg(fli1a:nEGFP)-positive ECs relative to Prox1 neuronal expression at stages indicated (t test: 32 hpf versus 36 hpf p = 0.0013, 36 hpf versus 48 hpf p = 0.0007, and 32 hpf versus 48 hpf p < 0.0001; mean [SD]). (G) Schematic representation of PCV polarization and Prox1 induction. |
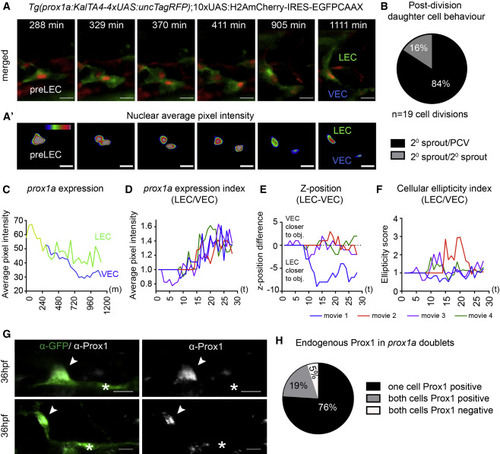
Bipotential prox1a-Positive Precursors in the PCV Give Rise to LECs and VECs (A) Maximum intensity projections from time lapse of cell division in a prox1a-positive pre-LEC Tg(prox1a:TagRFP) labeled with 10xUAS:H2AmCherry-IRES-GFPCAAX. Nuclei are red and membranes are green. Scale bars, 15 µm. (A′) Heatmap of average fluorescent intensity of prox1a:H2AmCherry nuclei depicted in (A) (scale bars, 15 µm). (B) Percentage daughter cell behaviors observed post-/pre-LEC division (84%, one cell migrating dorsally [2° sprout] and one remaining in the PCV; 16%, both daughter cells migrate dorsally; and 0%, both daughter cells remaining the PCV [n = 19 cell divisions]). (C) Average nuclear prox1a:H2AmCherry fluorescent intensity per pixel over time for movies shown in (A) and (A′), prior to division (yellow), LEC (green), and VEC (blue). (D) Index of LEC/VEC prox1a:H2AmCherry average nuclear fluorescent intensity per pixel over time taken from n = 4 independent time-lapse movies. Each color represents an independent division event (movie 1, blue; movie 2, red; movie 3, purple; and movie 4, green). (E) Difference in z-position of the LEC versus the VEC nucleus over time in corresponding time-lapse movies shown in (D). (F) Index of LEC/VEC nuclear ellipticity (longest axis/shortest axis) over time of corresponding time-lapse movies in (D). (G) Endogenous Prox1 (gray) in prox1a:Venus doublets (two cells side by side in isolation in the PCV [green]) at 36 hpf (a Prox1-positive cell [arrowhead]/Prox1-negative cell [asterisk], n = 18; upper and lower are two different examples. Scale bars, 15 µm. (H) Percentage of different Prox1 protein distribution patterns in prox1a positive doublets at 36 hpf (n = 21 doublets scored). |
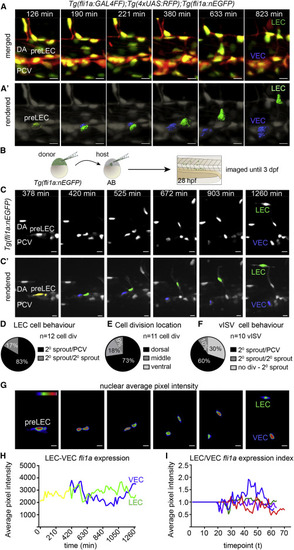
Endothelial Nuclear Dynamics Reveal Bipotential Precursor Behaviors (A) Maximum intensity projections from a time lapse of a dividing LEC precursor (pre-LEC) in the dorsal wall of the posterior cardinal vein (PCV), with Tg(fli1a:GALFF);Tg(4xUAS:RFP) in red and Tg(fli1a:nEGFP) in green (scale bars, 10 µm). DA, dorsa aorta; VEC, venous endothelial cell. (A′) Rendered Tg(fli1a:nEGFP) nuclei (gray) corresponding to A (pre-LEC, yellow; VEC, blue; LEC, green. Scale bars, 10 µm. (B) Schematic representation of transplantation approach with genotypes and stages indicated. (C) Maximum intensity projections from a time lapse of mosaically Tg(fli1a:nEGFP)-labeled embryo (D) Percentage of daughter cell behaviors post pre-LEC division (83%, one daughter cell migrating dorsally [2° sprout] and one remaining in the PCV; 17%, both migrate dorsally; and 0%, both remaining in the PCV, from n = 12 cell divisions). (E) Location of pre-LEC cell divisions within the PCV from (D). 73% of divisions occur in the dorsal half of the PCV, 18% at the midline (as shown in Figure 2), and 9% in the ventral half (n = 11 cell divisions). (F) Behavior for ECs contributing to vISVs. 60% of dorsal migration is preceded by cell division with one daughter cell migrating dorsally (2° sprout) and one remaining in the PCV, 10% is migration with both daughter cells migrating dorsally, and 30% is not preceded by cell division (from n = 10 movies). (G) Heatmap of average fluorescence intensity of Tg(fli1a:nEGFP) nuclei depicted in (C) and (C′). Scale bars, 12 µm. (H) Average nuclear Tg(fli1a:nEGFP) fluorescent intensity per pixel over time for movies shown in (C) and (C′). (I) Index of LEC/VEC Tg(fli1a:nEGFP) average nuclear fluorescence intensity per pixel over time taken from n = 4 time-lapse movies from mosaic nuclei. Each color represents an independent cell division.
|
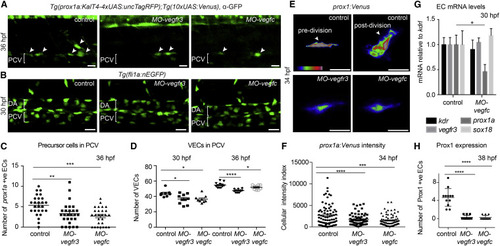
Vegfc Signaling Is Necessary for VEC Proliferation and Prox1 Expression (A) Maximum intensity projection of prox1a:Venus (α-GFP, green) at 36 hpf in control, MO-vegfr3, and MO-vegfc embryos in LEC precursors (arrowheads). PCV, posterior cardinal vein. (B) Maximum intensity projection of Tg(fli1a:nEGFP) at 30 hpf in control, MO-vegfr3, and MO-vegfc embryos across two somites in the posterior cardinal vein (PCV). DA, dorsal aorta. (C) Quantification of the number of prox1a positive LEC precursors (mean ± SEM) in MO-vegfr3- (n = 27) and MO-vegfc-injected (n = 27) embryos compared to controls (n = 26). Asterisks indicate significance (ANOVA p = 0.0456, p < 0.0001). (D) Quantification of VEC number at 30 and 36 hpf in Tg(fli1a:nEGFP) in control (n = 8, n = 12), MO-vegfr3 (n = 10, n = 11) and MO-vegfc (n = 9, n = 10; mean ± SEM). Asterisks indicate significance (ANOVA p = 0.0165, p = 0.0168). (E) Fluorescence intensity of prox1a:Venus in confocal projections of lymphatic precursors in MO-vegfr3 and MO-vegfc embryos compared with control cells pre- and post-division. (F) Quantification of prox1a:Venus average intensity per pixel in individual MO-vegfr3 (n = 62), MO-vegfc (n = 76), and control precursor cells (n = 75; mean ± SEM). Asterisks indicate significance (ANOVA p = 0.0058, p < 0.0001). (G) mRNA expression of kdr, vegfr3, prox1a, and sox18 in FACS EC populations from control and MO-vegfc embryos at 30 hpf. Graph represents gene expression relative to kdrl from three biological repeats (mean ± SEM). (H) Number of Prox1-protein-positive EC nuclei at 38 hpf in MO-vegfr3 (n = 12), MO-vegfc (n = 12), and control precursor cells (n = 12; mean ± SEM) scored across six somites. Asterisks indicate significance (ANOVA p < 0.0001). |
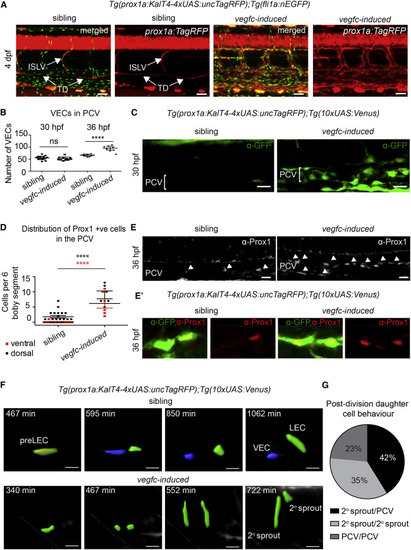
Vegfc Is Sufficient to Induce Prox1 Expression and Regulate Daughter Cell Behaviors (A) Maximum intensity projections of Tg(fli1a:nEGFP) in green and prox1a:TagRFP in red, with Tg(10xUAS:vegfc) (n = 8, vegfc-induced) and sibling (n = 8) embryos at 4 dpf. ISLV, intersegmental lymphatic vessels; TD, thoracic duct. Scale bar, 40 µm. (B) Quantification of VEC number at 30 and 36 hpf using Tg(fli1a:nEGFP) in sibling (30 hpf, n = 16; 36 hpf, n = 10 embryos) and vegfc-induced embryos (30 hpf, n = 11; 36 hpf, n = 10 embryos) (ANOVA p < 0.0001; mean [SD]). (C) Confocal projections of prox1a:Venus expression in the posterior cardinal vein (PCV) in sibling (n = 2) and vegfc-induced (n = 8) embryos at 30 hpf. Scale bar, 20 µm. (D) Number of Prox1-positive (antibody staining) cells in dorsal or ventral PCV in sibling (n = 20) and vegfc-induced (n = 6) embryos scored across six somites at 36 hpf. vegfc-induced embryos showed a 5-fold increase in dorsal wall cells and further increase in ventral wall cells (mean ± SEM). (E) Confocal projections of endogenous Prox1 expressing cells (gray) in vegfc-induced (n = 10) and sibling embryos (n = 18) (scale bar, 20 µm) at 36 hpf. (E′) Confocal projections of prox1a:Venus-expressing cells co-stained with endogenous Prox1. In vegfc-induced (n = 11) embryos, Prox1 was present in all prox1a:Venus-positive cells compared with control cells (n = 8). (F) Confocal projections from time lapse of sibling (top) and vegfc-induced (bottom) embryos showing rendered prox1a:Venus cells (pre-LEC, yellow; VEC, blue; LEC, green. Scale bar, 20 µm. (G) Quantification of daughter cell behaviors from prox1a-positive precursors in vegfc-induced embryos visualized in time lapse from 30 hpf. In 42%, one cell migrated dorsally (2° sprout) and one remained in the PCV; in 35%, both daughter cells migrated dorsally; and in 23%, both cells remained in the PCV (from n = 17 cell divisions scored in n = 10 movies). |
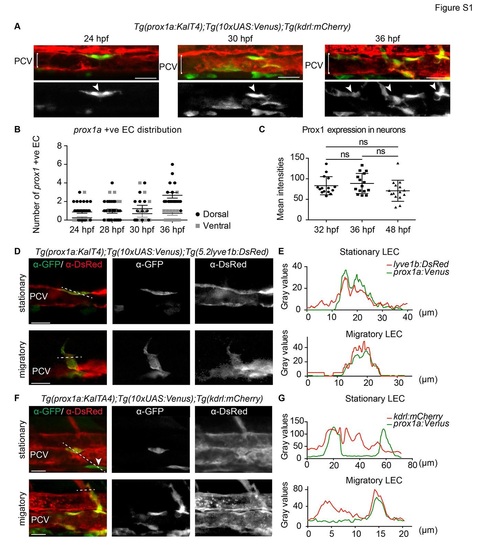
Early prox1a:Venus localisation with venous and blood endothelial markers (A) Confocal projection of Tg(prox1a:KalTA4);Tg(10xUAS:Venus);Tg(kdrl:mCherry) double positive cells (arrowheads) in the posterior cardinal vein (PCV) at 24, 30 and 36 hpf (scale bar=30µm). (B) Quantification of the number of prox1a:Venus positive ECs in dorsal (black dots) and ventral (grey dots) PCV at 24 hpf (n=33), 28 hpf (n=24), 30 hpf (n=13) and 36 hpf (n=18, mean ± SEM). (C) Quantification of endogenous Prox1 expression intensities in neurons within embryos used to normalise endothelial Prox1 against neuronal expression giving the final intensity index represented in Figure 2F (n=15 for all the time points, mean (SD). (D) Single confocal projection of immunofluorescent labelling of a Tg(prox1a:KalTA4);Tg(10xUAS:Venus) (&alpha-GFP); Tg(lyve1b:DsRed) (&alpha-DsRed) double positive stationary cell located in the dorsal wall of the PCV (upper panel) and a double positive migratory cell connected to the wall of the PCV (lower panel) at 34 hpf (scale bar=20µm). (E) Fluorescence intensity grey values of Tg(prox1a:KalTA4);Tg(10xUAS:Venus) (&alpha-GFP, green) and Tg(lyve1b:DsRed) (&alpha-DsRed, red) in planes depicted by the dotted lines in (D) indicating overlapping expression profiles. (F) Single confocal projection of immunofluorescent labelling of Tg(prox1a:KalTA4);Tg(10xUAS:Venus) (&alpha-GFP) and Tg(kdrl:mCherry) (&alpha-DsRed) expressing cells at 34 hpf. Upper panel: a double positive stationary cell located in the dorsal wall of the PCV and a Tg(prox1a:KalTA4);Tg(10xUAS:Venus) positive Tg(kdrl:mCherry) negative cell localised outside the ventral wall of the PCV (arrowhead). Lower panel: a double positive migratory cell connected to the wall of the PCV (scale bar=20µm). 3 (G) Fluorescent intensity grey values of Tg(prox1a:KalTA4);Tg(10xUAS:Venus) (&alpha-GFP, green) and Tg(kdrl:mCherry) (&alpha-DsRed, red) across planes indicated by dotted lines in (F) indicating the double positive cell and Tg(kdrl:mCherry) negative cell (stationary LEC) and double positive migratory cell (migratory LEC). |
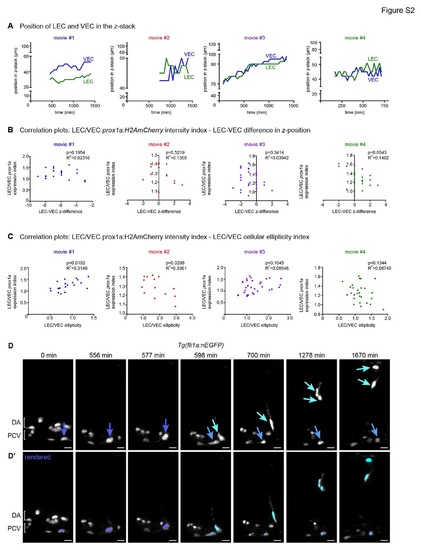
Additional controls for prox1a expression changes and annotated movie of venous intersegmental vessel formation (A) Position of the centre of the LEC nucleus (green) and VEC nucleus (blue) within the total z-plane of movies 1 to 4 (Figure 3) (movie 1= blue, movie 2 = red, movie 3 = purple, movie 4 = green). (B) Correlation analysis of LEC/VEC prox1a:H2AmCherry expression intensity index and the proximity difference of these cells relative to the objective of movies 1 to 4 (Figure 3) (movie 1= no correlation, movie 2 = no correlation, movie 3 = no correlation, movie 4 = no correlation). (C) Correlation analysis of LEC/VEC prox1a:H2AmCherry expression index and LEC/VEC nuclear ellipticity index of movies 1 to 4 (Figure 3) (movie 1= correlation p=0.0102, movie 2 = inverse correlation p=0.0298, movie 3 = no correlation, movie 4 = no correlation). (D) Maximum intensity projections from timelapse Movie S6 of a Tg(fli1a:nEGFP) mosaically labelled embryo (nuclei in grey) showing a cell division in the wall of the PCV (dark blue arrow) giving rise to a dorsal migrating venous intersegmental vessel (vISV, aqua arrow) and a VEC (light blue arrow) that remains in the PCV (scale bar=20µm). DA=dorsal aorta, PCV=posterior cardinal vein. Representative of the movies used to quantify data summarised in Figure 4F. (D′) Rendered Tg(fli1a:nEGFP) nuclei corresponding to timepoints depicted in A; PCV EC pre-cell division=dark blue, vISV=aqua, PCV VEC=light blue (scale bar=20µm). DA=dorsal aorta, PCV=posterior cardinal vein. |
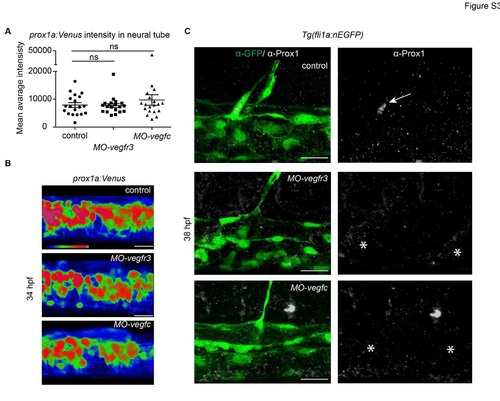
prox1a:Venus intensity endogenous Prox1 expression in Vegfr3 and Vegfc morphants (A) Quantification of prox1a:Venus mean average fluorescent intensity in individual MOvegfr3 (n=20), MO-vegfc (n=20) and control (n=19) embryos in a standard region of the neural tube (mean ± SEM) (ANOVA ns - not significant). (B) Average fluorescent intensity projection of prox1a:Venus expression in the neural tube of MO-vegfr3 and MO-vegfc embryos compared with controls (scale bars=20µm). (C) Endogenous Prox1-positive (grey) endothelial cell (arrow) in the trunk of an uninjected control embryo (upper panel) and absence (asterisks) of Prox1 expression in vegfr3 (middle panel) and vegfc (lower panel) morpholino injected embryos at 38 hpf. Co-labelling by Tg(fli1a:nEGFP) (α-GFP, green) (scale bar=20µm). |
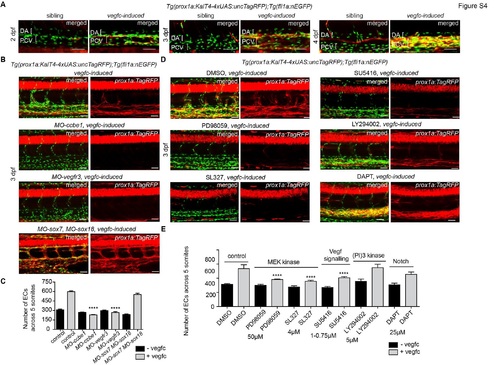
Vegfc-signalling through Vegfr3/Mek/Erk is sufficient to induce VEC proliferation and prox1a expression (A) Maximum intensity projections of Tg(fli1a:nEGFP) in green and prox1a:TagRFP in red in sibling (left panel, n=12) and vegfc-induced (right panel, n=13) embryos at 2, 3 and 4 dpf (scale bars=50µm). At all stages induction of Vegfc results in expansion of VEC number and ectopic prox1a expression in venous endothelial cells (PCV=posterior cardinal vein) but not in arterial endothelial cells (DA=dorsal aorta). (B) Maximum intensity projections of Tg(fli1a:nEGFP) in green and prox1a:TagRFP in red, with Tg(10xUAS:vegfc) of vegfc-induced uninjected embryos, vegfc-induced;MO-ccbe1 injected embryos, vegfc-induced;MO-vegfr3 injected embryos and vegfc-induced;MOsox7; MO-sox18 injected embryos at 3 dpf (for n-values see Table S1, scale bars=40µm). (C) Quantification of EC number in: control (n=12 embryo projections analysed); vegfc-induced (n=34); MO-ccbe1 (n=6); vegfc-induced, MO-ccbe1 (n=24); MO-vegfr3 (n=11), vegfc-induced, MO-vegfr3 (n=16); MO-sox7, MO-sox18 (n=11); and vegfc-induced, MOsox7, MO-sox18 embryos (n=25) (mean ± SEM, ANOVA ****p<0.0001). (D) Maximum intensity projections of Tg(fli1a:nEGFP) in green and prox1a:TagRFP in red, with Tg(10xUAS:vegfc) of vegfc-induced DMSO treated controls, vegfc-induced PD98059 treated, vegfc-induced SL327 (Mek inhibitor) treated, vegfc-induced SU5416 treated (Vegfr inhibitor), vegfc-induced LY294002 treated (PI3K inhibitor) and vegfc-induced DAPT treated (γ-secretase/Notch signalling inhibitor) embryos (for n-values see Table S1, scale bars=40µm). (E) Quantification of EC number in: DMSO (n=6 embryo projections analysed); vegfc-induced DMSO (n=10); PD98059 (Mek inhibitor) (n=5); vegfc-induced PD98059 (n=17); SL327 (Mek inhibitor) (n=4); vegfc-induced SL327 (n=11); SU5416 (Vegfr inhibitor) (n=8); vegfc-induced SU5416 (n=20); LY294002 (Pi3K inhibitor) (n=7); vegfc-induced LY294002 (n=6); DAPT (γ-secretase/Notch signalling inhibitor) (n=7); and vegfc-induced DAPT (n=7), The significance was calculated by comparing the treated samples to DMSO control and treated vegfc-induced to DMSO vegfc-induced control (mean ± SEM, ANOVA ****p<0.0001). |