
|
Fig. 2
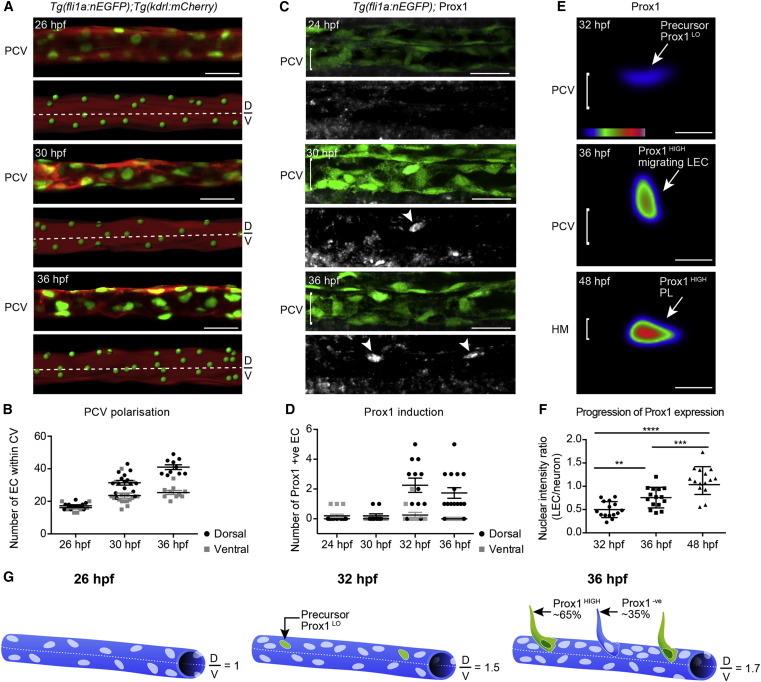
The PCV Becomes Structurally Polarized and Initiates Prox1 Expression before Secondary Angiogenesis
(A) Confocal projection of Tg(fli1a:nEGFP);Tg(kdrl:mCherry) labeling endothelial cell (EC) nuclei (green) and membrane (red) showing the PCV (upper) and rendered signal (lower) at 26, 30, and 36 hpf (scored across 3 body segments). D, dorsal; V, ventral. Scale bar, 30 µm.
(B) Quantification of EC number in the dorsal (black circles) and ventral (gray squares) halves of the PCV scored in lateral projections at 26 hpf (n = 10), 30 hpf (n = 16), and 36 hpf (n = 10) (scored across 3 body segments) (mean ± SEM).
(C) Endogenous Prox1 (gray, lower) in the trunk vasculature of Tg(fli1a:nEGFP) embryos (α-GFP, green, top) at 24, 30, and 36 hpf (scored across 3 body segments). Scale bar, 30 µm.
(D) Quantification of the number of Prox1 positive ECs in dorsal and ventral halves of the PCV at 24 hpf (n = 15), 30 hpf (n = 10), 32 hpf (n = 12), and 36 hpf (n = 12) (scored across 3 body segments) (mean ± SEM).
(E) Heatmap of average intensity projection of Prox1-positive ECs at 32, 36, and 48 hpf. Scale bar, 10 µm.
(F) Quantification of Prox1 protein expression intensity in Tg(fli1a:nEGFP)-positive ECs relative to Prox1 neuronal expression at stages indicated (t test: 32 hpf versus 36 hpf p = 0.0013, 36 hpf versus 48 hpf p = 0.0007, and 32 hpf versus 48 hpf p < 0.0001; mean [SD]).
(G) Schematic representation of PCV polarization and Prox1 induction.