
Fig. 4
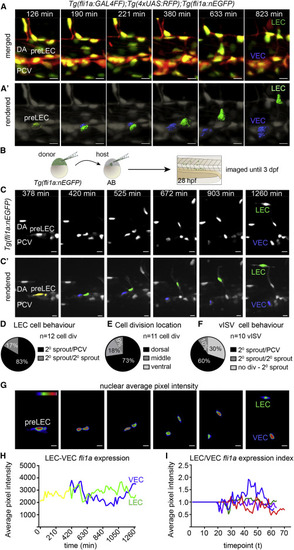
Endothelial Nuclear Dynamics Reveal Bipotential Precursor Behaviors (A) Maximum intensity projections from a time lapse of a dividing LEC precursor (pre-LEC) in the dorsal wall of the posterior cardinal vein (PCV), with Tg(fli1a:GALFF);Tg(4xUAS:RFP) in red and Tg(fli1a:nEGFP) in green (scale bars, 10 µm). DA, dorsa aorta; VEC, venous endothelial cell. (A′) Rendered Tg(fli1a:nEGFP) nuclei (gray) corresponding to A (pre-LEC, yellow; VEC, blue; LEC, green. Scale bars, 10 µm. (B) Schematic representation of transplantation approach with genotypes and stages indicated. (C) Maximum intensity projections from a time lapse of mosaically Tg(fli1a:nEGFP)-labeled embryo (D) Percentage of daughter cell behaviors post pre-LEC division (83%, one daughter cell migrating dorsally [2° sprout] and one remaining in the PCV; 17%, both migrate dorsally; and 0%, both remaining in the PCV, from n = 12 cell divisions). (E) Location of pre-LEC cell divisions within the PCV from (D). 73% of divisions occur in the dorsal half of the PCV, 18% at the midline (as shown in Figure 2), and 9% in the ventral half (n = 11 cell divisions). (F) Behavior for ECs contributing to vISVs. 60% of dorsal migration is preceded by cell division with one daughter cell migrating dorsally (2° sprout) and one remaining in the PCV, 10% is migration with both daughter cells migrating dorsally, and 30% is not preceded by cell division (from n = 10 movies). (G) Heatmap of average fluorescence intensity of Tg(fli1a:nEGFP) nuclei depicted in (C) and (C′). Scale bars, 12 µm. (H) Average nuclear Tg(fli1a:nEGFP) fluorescent intensity per pixel over time for movies shown in (C) and (C′). (I) Index of LEC/VEC Tg(fli1a:nEGFP) average nuclear fluorescence intensity per pixel over time taken from n = 4 time-lapse movies from mosaic nuclei. Each color represents an independent cell division.
|