
Fig. S1
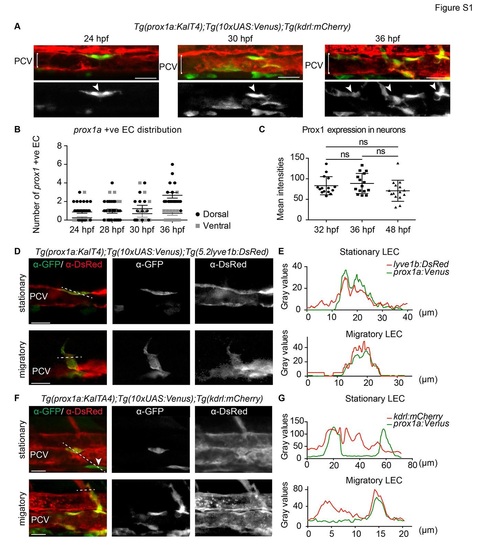
Early prox1a:Venus localisation with venous and blood endothelial markers (A) Confocal projection of Tg(prox1a:KalTA4);Tg(10xUAS:Venus);Tg(kdrl:mCherry) double positive cells (arrowheads) in the posterior cardinal vein (PCV) at 24, 30 and 36 hpf (scale bar=30µm). (B) Quantification of the number of prox1a:Venus positive ECs in dorsal (black dots) and ventral (grey dots) PCV at 24 hpf (n=33), 28 hpf (n=24), 30 hpf (n=13) and 36 hpf (n=18, mean ± SEM). (C) Quantification of endogenous Prox1 expression intensities in neurons within embryos used to normalise endothelial Prox1 against neuronal expression giving the final intensity index represented in Figure 2F (n=15 for all the time points, mean (SD). (D) Single confocal projection of immunofluorescent labelling of a Tg(prox1a:KalTA4);Tg(10xUAS:Venus) (&alpha-GFP); Tg(lyve1b:DsRed) (&alpha-DsRed) double positive stationary cell located in the dorsal wall of the PCV (upper panel) and a double positive migratory cell connected to the wall of the PCV (lower panel) at 34 hpf (scale bar=20µm). (E) Fluorescence intensity grey values of Tg(prox1a:KalTA4);Tg(10xUAS:Venus) (&alpha-GFP, green) and Tg(lyve1b:DsRed) (&alpha-DsRed, red) in planes depicted by the dotted lines in (D) indicating overlapping expression profiles. (F) Single confocal projection of immunofluorescent labelling of Tg(prox1a:KalTA4);Tg(10xUAS:Venus) (&alpha-GFP) and Tg(kdrl:mCherry) (&alpha-DsRed) expressing cells at 34 hpf. Upper panel: a double positive stationary cell located in the dorsal wall of the PCV and a Tg(prox1a:KalTA4);Tg(10xUAS:Venus) positive Tg(kdrl:mCherry) negative cell localised outside the ventral wall of the PCV (arrowhead). Lower panel: a double positive migratory cell connected to the wall of the PCV (scale bar=20µm). 3 (G) Fluorescent intensity grey values of Tg(prox1a:KalTA4);Tg(10xUAS:Venus) (&alpha-GFP, green) and Tg(kdrl:mCherry) (&alpha-DsRed, red) across planes indicated by dotted lines in (F) indicating the double positive cell and Tg(kdrl:mCherry) negative cell (stationary LEC) and double positive migratory cell (migratory LEC). |