
|
Fig. S3
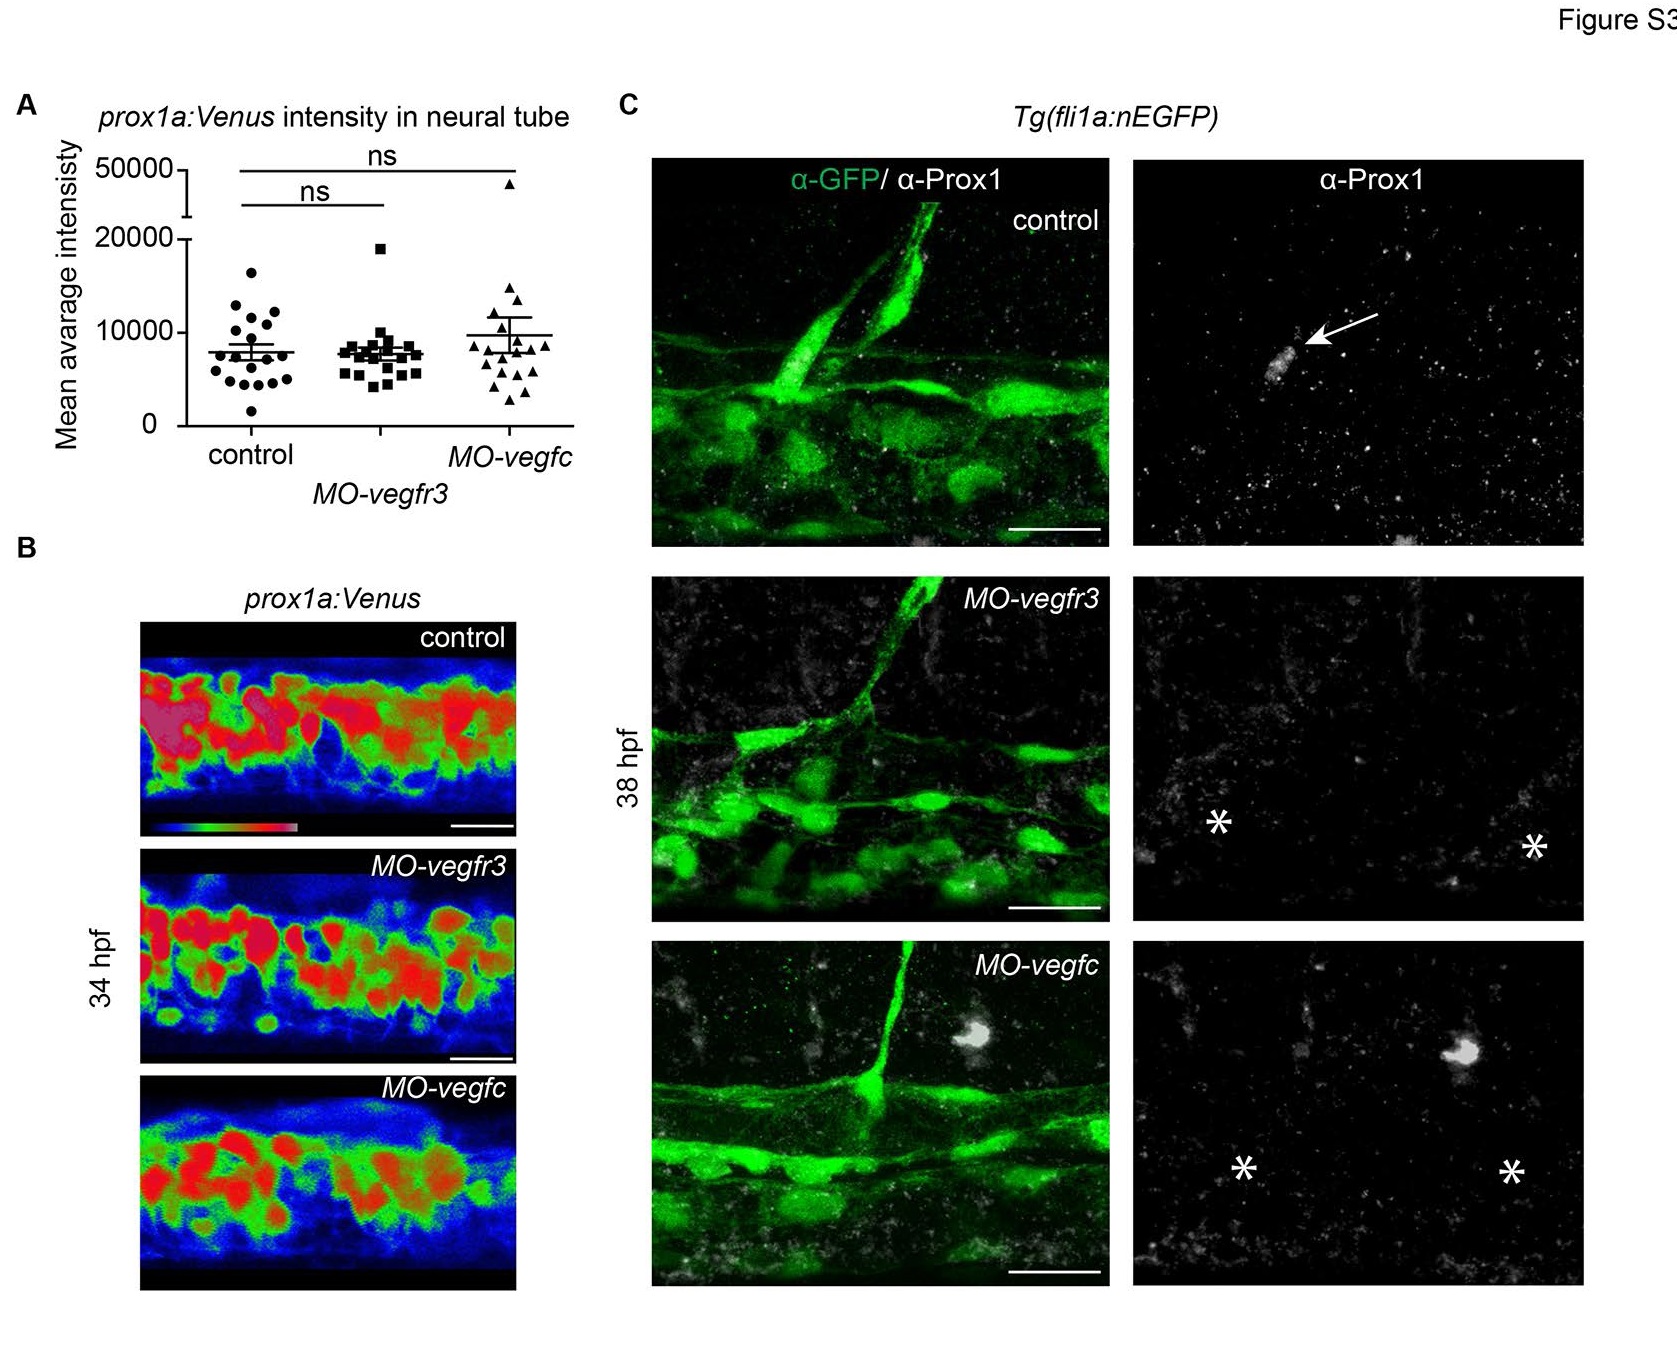
prox1a:Venus intensity endogenous Prox1 expression in Vegfr3 and Vegfc morphants
(A) Quantification of prox1a:Venus mean average fluorescent intensity in individual MOvegfr3 (n=20), MO-vegfc (n=20) and control (n=19) embryos in a standard region of the neural tube (mean ± SEM) (ANOVA ns - not significant).
(B) Average fluorescent intensity projection of prox1a:Venus expression in the neural tube of MO-vegfr3 and MO-vegfc embryos compared with controls (scale bars=20µm).
(C) Endogenous Prox1-positive (grey) endothelial cell (arrow) in the trunk of an uninjected control embryo (upper panel) and absence (asterisks) of Prox1 expression in vegfr3 (middle panel) and vegfc (lower panel) morpholino injected embryos at 38 hpf. Co-labelling by Tg(fli1a:nEGFP) (α-GFP, green) (scale bar=20µm).