
|
Fig. S2
Additional controls for prox1a expression changes and annotated movie of venous intersegmental vessel formation
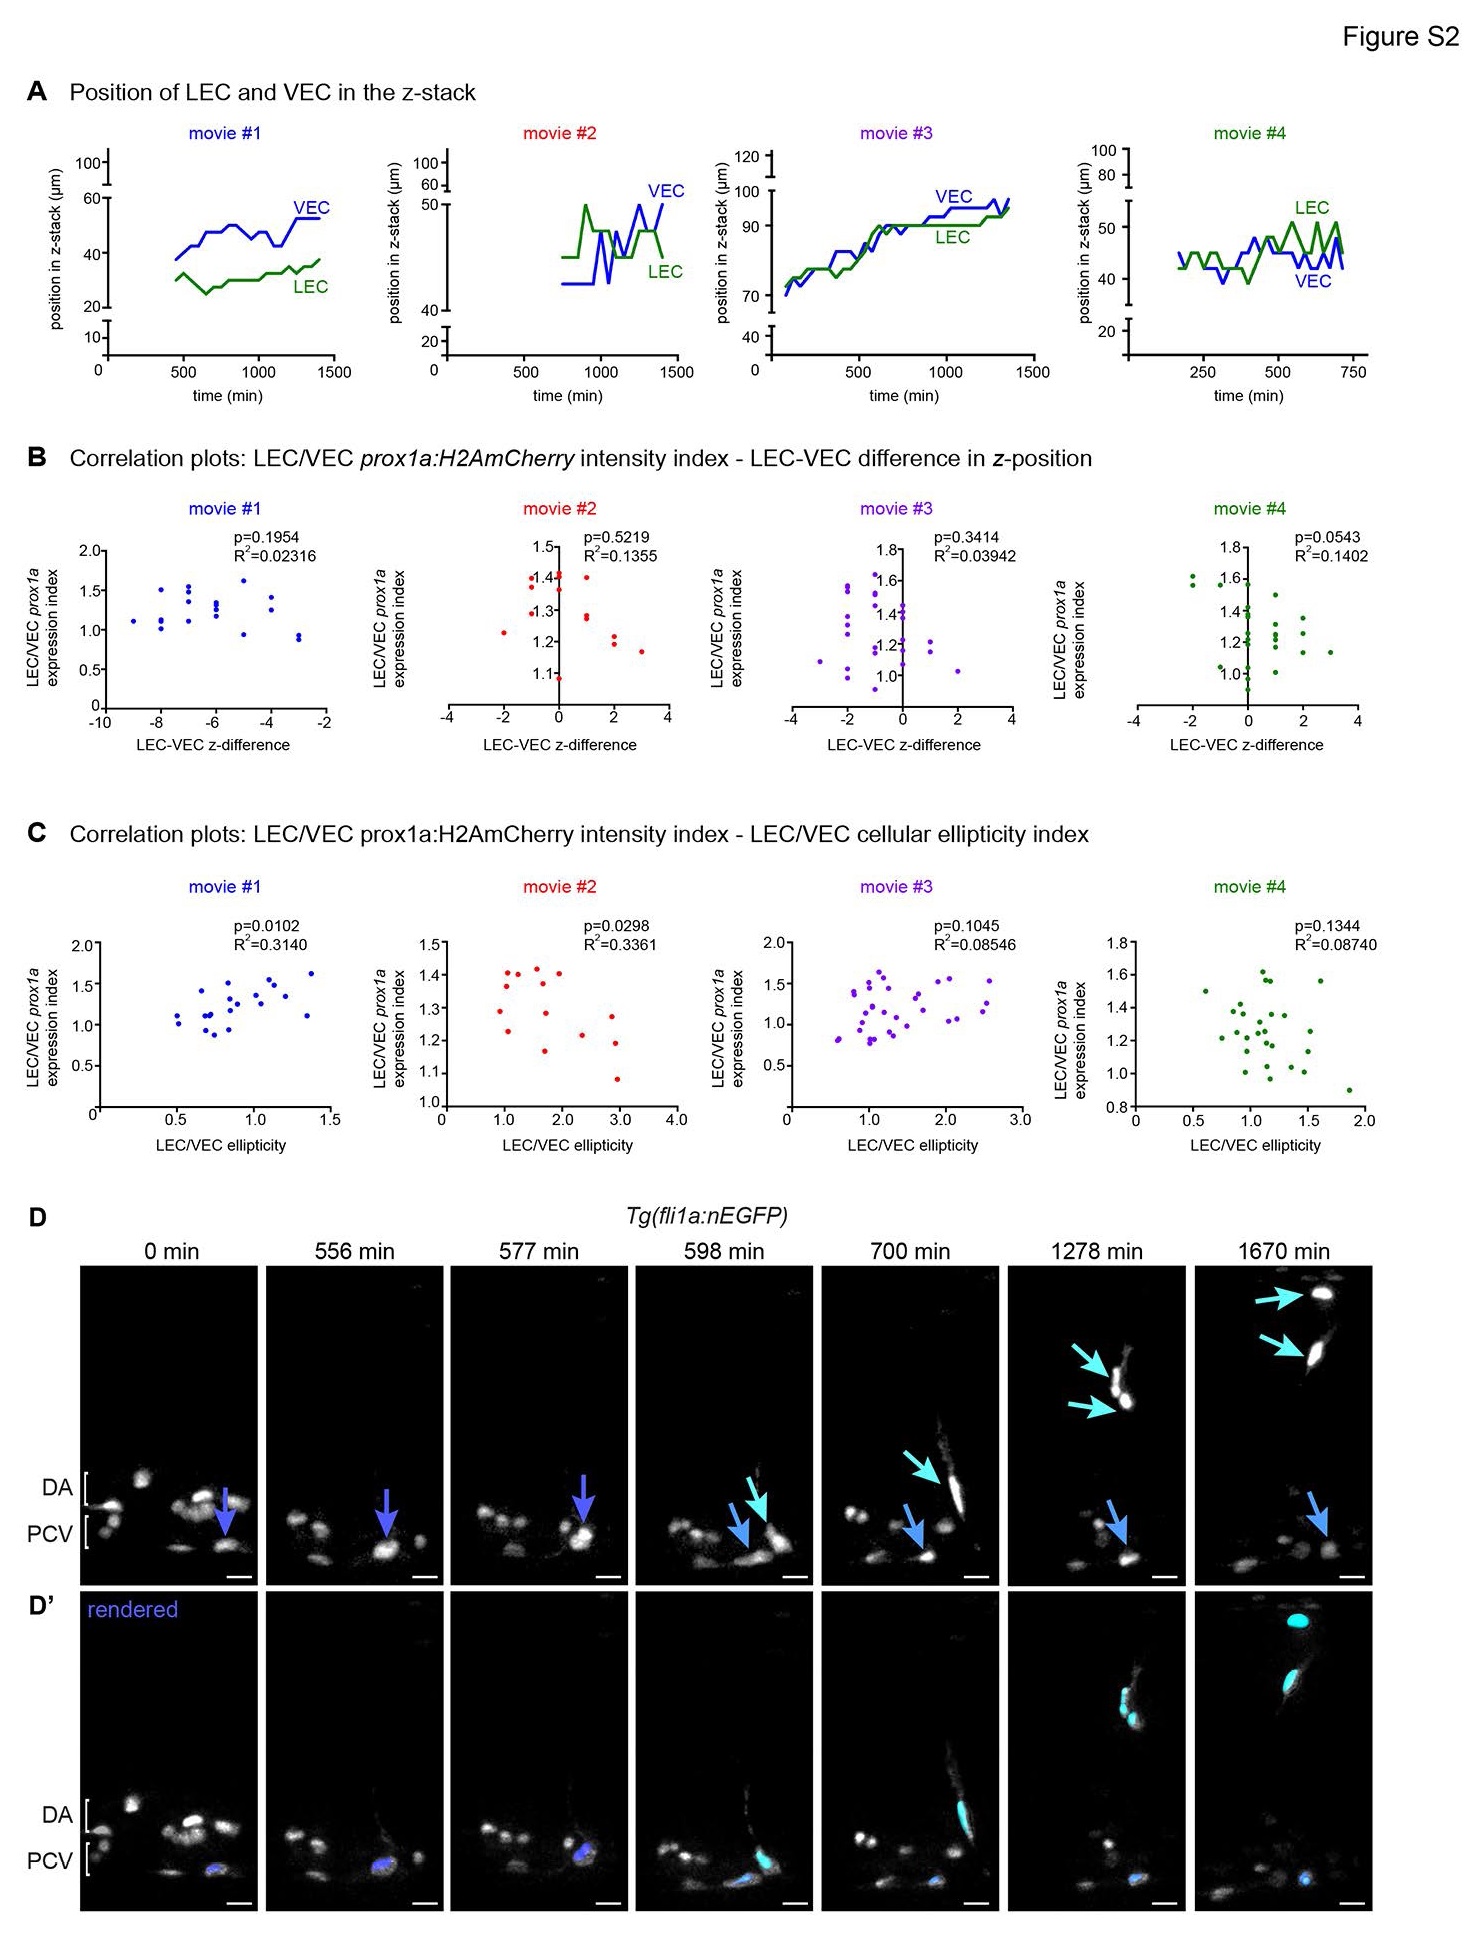
(A) Position of the centre of the LEC nucleus (green) and VEC nucleus (blue) within the total z-plane of movies 1 to 4 (Figure 3) (movie 1= blue, movie 2 = red, movie 3 = purple, movie 4 = green).
(B) Correlation analysis of LEC/VEC prox1a:H2AmCherry expression intensity index and the proximity difference of these cells relative to the objective of movies 1 to 4 (Figure 3) (movie 1= no correlation, movie 2 = no correlation, movie 3 = no correlation, movie 4 = no correlation).
(C) Correlation analysis of LEC/VEC prox1a:H2AmCherry expression index and LEC/VEC nuclear ellipticity index of movies 1 to 4 (Figure 3) (movie 1= correlation p=0.0102, movie 2 = inverse correlation p=0.0298, movie 3 = no correlation, movie 4 = no correlation).
(D) Maximum intensity projections from timelapse Movie S6 of a Tg(fli1a:nEGFP) mosaically labelled embryo (nuclei in grey) showing a cell division in the wall of the PCV (dark blue arrow) giving rise to a dorsal migrating venous intersegmental vessel (vISV, aqua arrow) and a VEC (light blue arrow) that remains in the PCV (scale bar=20µm). DA=dorsal aorta, PCV=posterior cardinal vein. Representative of the movies used to quantify data summarised in Figure 4F.
(D′) Rendered Tg(fli1a:nEGFP) nuclei corresponding to timepoints depicted in A; PCV EC pre-cell division=dark blue, vISV=aqua, PCV VEC=light blue (scale bar=20µm). DA=dorsal aorta, PCV=posterior cardinal vein.