
- Title
-
VEGF-B-Neuropilin-1 signaling is spatiotemporally indispensable for vascular and neuronal development in zebrafish
- Authors
- Jensen, L.D., Nakamura, M., Bräutigam, L., Li, X., Liu, Y., Samani, N.J., Cao, Y.
- Source
- Full text @ Proc. Natl. Acad. Sci. USA
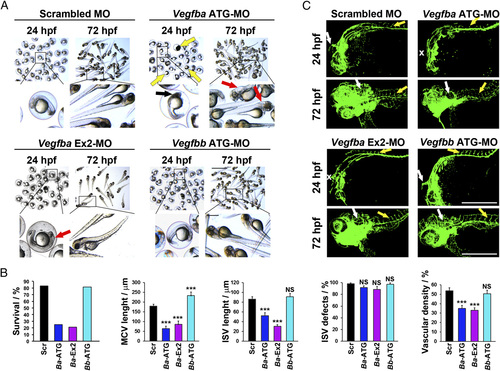
Gross and vascular phenotypes of Vegfba and Vegfbb knockdown in zebrafish embryos. (A) Micrographs of zebrafish embryos injected with 0.6 pmol of Scrambled, Vegfba-ATG, Vegfba-Ex2, or Vegfbb-ATG–targeted morpholinos, and embryos were visualized at 24 or 72 hpf. Black arrows indicate embryos with widespread cell death in the brain; yellow arrows indicate dead embryos; red arrows indicate embryos with cerebral edema. (Scale bar, 1 mm; in the amplified picture, 200 µm.) (B) Quantifications of the percentage of surviving embryos, MCV and ISV length at 24 hpf, percentage of defective ISVs at 72 hpf, and the vascular density in the brain of 72-hpf embryos injected with 0.6 pmol of Scrambled, Vegfba-ATG (Ba-ATG), Vegfba-Ex2 (Ba-Ex2), or Vegfbb-ATG (Bb-ATG)-targeted morpholinos (average n = 85 embryos/group). NS, nonsignificant; ***P < 0.001. (C) Confocal micrographs of Tg(fli1a:EGFP) embryos at 24 or 72 hpf injected with 0.6 pmol of Scrambled, Vegfba-ATG, Vegfba-Ex2 or Vegfbb-ATG–targeted morpholinos. White arrows point to the MCV or the brain vasculature affected at 72 hpf. White X symbols mark the positions where MCVs were missing. Yellow arrows point to ISVs. (Scale bars, 500 µm.) PHENOTYPE:
|
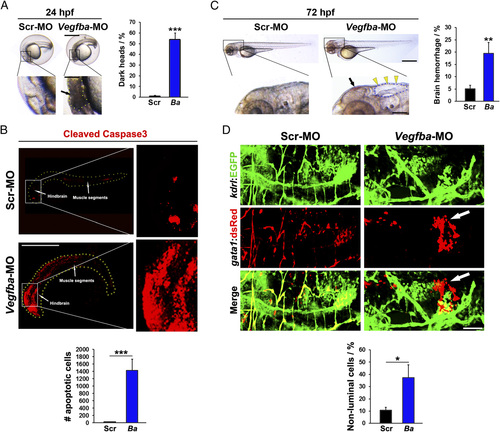
Brain cell death and hemorrhage of VEGF-B–deficient zebrafish embryos. (A) Micrographs of embryos injected with 0.6 pmol Scrambled or Vegfba morpholino; embryos were imaged at 24 hpf. (Scale bar, 200 µm; bar in amplified picture, 50 µm.) Black arrow points to the brain area with dead cells, and dotted line encircles the dead area. Quantification of the percentage of embryos with obvious dead areas in the brain at 24 hpf (average n = 229 embryos/group). ***P < 0.001. (B) Confocal micrographs of embryos injected with 0.6 pmol Scrambled or Vegfba morpholino and stained for cleaved caspase3 activity at 24 hpf. (Scale bar, 500 µm.) Quantification of numbers of cleaved caspase3-positive cells (n = 18–21 embryos/group). ***P < 0.001. (C) Micrographs of embryos injected with 0.6 pmol Scrambled or Vegfba morpholino; embryos were imaged at 72 hpf. (Scale bar, 200 µm; in amplified picture, 50 µm.) Yellow arrowheads point to cerebral edema, and dotted line encircles the edema area. Black arrow points to brain hemorrhage. Quantification of the percentage of embryos with brain hemorrhages at 72 hpf (n = 222–295 embryos/group). **P < 0.01. (D) Confocal micrographs of Tg(Kdrl:egfp;Gata1:DsRed) embryos injected with 0.6 pmol Scrambled or Vegfba morpholino; the injected embryos were imaged at 72 hpf. (Scale bar, 50 µm.) White arrows point to hemorrhagic erythrocytes. Quantification of ratios between extravasated erythrocytes versus the total erythrocyte signals (n = 6 embryos/group). *P < 0.05. PHENOTYPE:
|
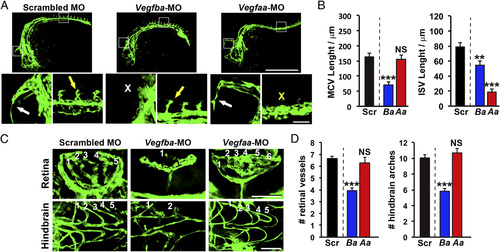
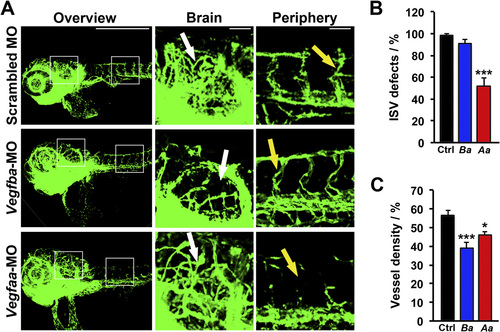
Distinct vascular defective phenotypes in VEGF-B and VEGF-A–deficient zebrafish embryos. (A) Confocal micrographs of 24-hpf fli1a:EGFP embryos injected with 0.6 pmol of Scrambled, Vegfba, or Vegfaa morpholinos. White arrows indicate the MCV, and the white X indicates the position where the MCV is missing. Yellow arrows indicate the ISVs, and the yellow X indicates the position where ISVs are missing. (Scale bar, 500 µm; bar in the amplified picture, 50 µm.) (B) Quantifications of MCV or ISV lengths in 24-hpf embryos injected with 0.6 pmol of Scrambled (Ctrl), Vegfba (Ba), or Vegfaa (Aa) morpholinos (n = 8–24 embryos/group). NS, nonsignificant. **P < 0.01; ***P < 0.001. (C) Confocal micrographs of the retina or hindbrain regions in 72-hpf fli1a:EGFP embryos injected with 0.6 pmol of Scrambled, Vegfba, or Vegfaa morpholinos. Sequential numbers indicate the number of retinal vessels or the number of hindbrain arches. (Scale bar, 50 µm.) (D) Quantification of retinal vessel and hindbrain arch numbers in 72-hpf embryos injected with 0.6 pmol of Scrambled (Ctrl), Vegfba (Ba), or Vegfaa (Aa) morpholinos (n = 7–24 embryos/group). NS, nonsignificant; ***P < 0.001. PHENOTYPE:
|
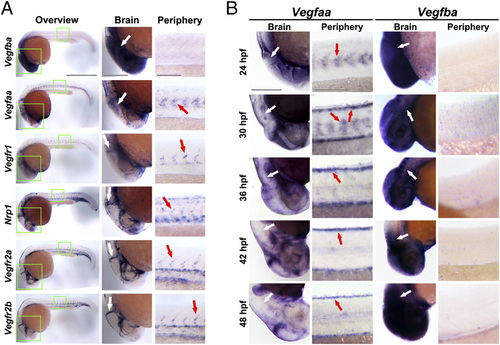
mRNA expression levels of Vegfa, Vegfb, and Vegfrs in developing zebrafish embryos. (A) In situ hybridization micrographs of Vegfba, Vegfaa, Vegfr1, Nrp1, Vegfr2a, or Vegfr2b expression in 24-hpf zebrafish embryos. In situ positive signals are in dark blue. White arrows indicate MCVs (Vegfr1, Nrp1, Vegfr2a, and Vegfr2b images) or the MCV area (Vegfba and Vegfaa images). Red arrows indicate somites (Vegfaa) or ISVs. (Scale bar in overview: 500 µm; in brain: 200 µm; in periphery: 100 µm.) (B) In situ hybridization micrographs of Vegfba or Vegfaa expression in the brain or peripheral trunk regions of zebrafish embryos at 24, 30, 36, 42, or 48 hpf. In situ positive signals are in dark blue. White arrows indicate the MCV area. Red arrows indicate the peripheral expression-pattern of Vegfaa mRNA. (Scale bars in the brain, 200 µm; in periphery, 100 µm.) |
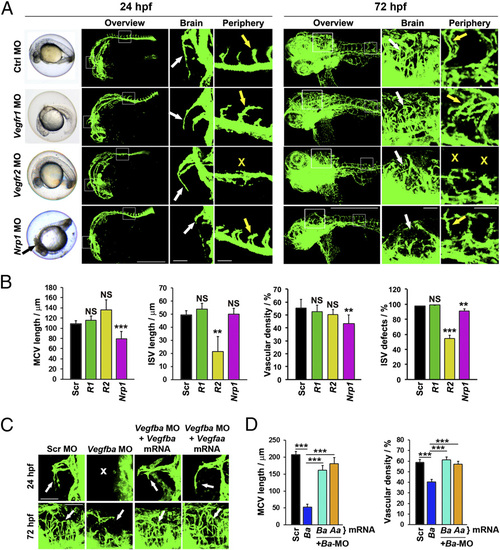
VEGFR deficiency-associated vascular phenotypes and functional rescue by Vegfba or Vegfaa mRNAs. (A) Bright-field and confocal micrographs of 24- and 72-hpf fli1a:EGFP zebrafish embryos injected with 0.6 pmol of Scrambled, Vegfr1, Vegfr2, or Nrp1 morpholinos. Black arrow indicates zebrafish brain with dead cells. White arrows indicate 24-hpf MCVs and the 72-hpf brain vasculatures. Yellow arrows indicate ISVs. Yellow X symbols indicate absence of ISVs. (Scale bars in overviews, 500 µm; in brain and periphery, 50 µm.) (B) Quantifications of 24-hpf MCV length, ISV length, 72-hpf brain vascular density, and percentage of defective ISVs after treatment with 0.6 pmol of Scrambled (Ctrl), Vegfr1 (R1), Vegfr2 (R2), or Nrp1 morpholinos (average of n = 14 embryos/group). NS, nonsignificant. **P < 0.01, ***P < 0.001. (C) Confocal images of 24- and 72-hpf fli1a:EGFP embryos injected with 0.6 pmol of Scrambled or Vegfba morpholinos alone or in combinations with 100 ng Vegfba or Vegfaa mRNAs. White arrows indicate 24- MCVs and 72-hpf brain vasculatures. White X indicates absence of the MCV. (Scale bars, 50 µm.) (D) Quantification of 24-hpf MCV length and 72-hpf brain vascular density of fli1a:EGFP embryos injected with 0.6 pmol of Scrambled (Ctrl) or Vegfba (Ba) morpholinos alone or in combinations with 100 ng Vegfba or Vegfaa (Aa) mRNAs (average of n = 16 embryos/group). ***P < 0.001. PHENOTYPE:
|
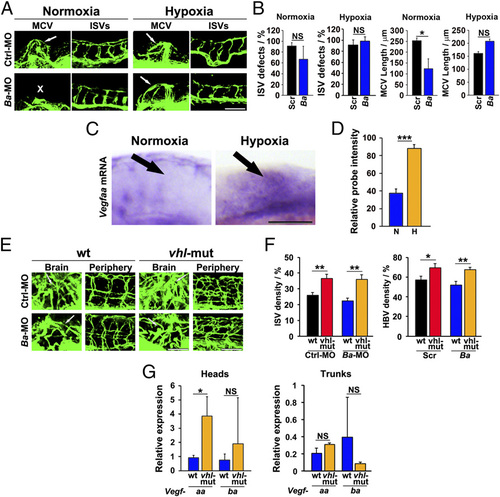
Hypoxia rescues VEGF-B deficiency-induced vascular defects in zebrafish embryos. (A) Confocal micrographs of 36-hpf stage Fli1a:EGFP zebrafish embryos injected with 0.6 pmol Scrambled (Ctrl) and Vegfba (Ba) morpholinos. The injected embryos were subjected to an E3 medium at normal oxygen tension (normoxia) or to a hypoxic environment where the oxygen tension was reduced to 1.5% (hypoxia). White arrows indicate the MCVs. White X indicates the absence of the MCV. (Scale bar, 100 µm.) (B) Quantification of ISV defects and MCV lengths at the 36-hpf stage of Fli1a:EGFP zebrafish embryos injected with 0.6 pmol Scrambled (Ctrl) or Vegfba (Ba) morpholinos. The injected embryos were subjected to an E3 medium under normoxia or hypoxia conditions (n = 11–21 embryos/group). NS, nonsignificant. *P < 0.05. (C) Detection of Vegfaa mRNA by in situ hybridization of 36-hpf stage embryos exposed to an E3 medium under normoxia or hypoxia. Black arrows indicate the MCV area. (Scale bar, 100 µm.) (D) Quantification of in situ hybridization positive signals under normoxia (N) and hypoxia (H) conditions (n = 35 embryos/group). ***P < 0.001. (E) Confocal micrographs of Fli1a:EGFP-wt (wt) or Fli1a:EGFP-vhl-mutant (vhl-mut) 120-hpf zebrafish embryos injected with 0.6 pmol scrambled (Ctrl) or Vegfba (Ba) morpholinos. White arrows indicate the brain vasculatures. (Scale bar in , 50 µm; bar in periphery, 100 µm.) (F) Quantification of ISV and brain vascular (HBV) density in Fli1a:EGFP-wt (wt) or Fli1a:EGFP-vhl-mutant (vhl-mut) 120-hpf zebrafish embryos injected with 0.6 pmol scrambled (Ctrl) or Vegfba (Ba) morpholinos (n = 9–17 embryos/group). *P < 0.05; **P < 0.01. (G) qPCR analysis of the relative expression of Vegfaa or Vegfba mRNA levels in heads and trunks of 120-hpf Fli1a:EGFP-wt (wt) or Fli1a:EGFP-vhl-mutant (vhl-mut) zebrafish embryos (60–150 embryos/group). NS, nonsignificant. *P < 0.05. |
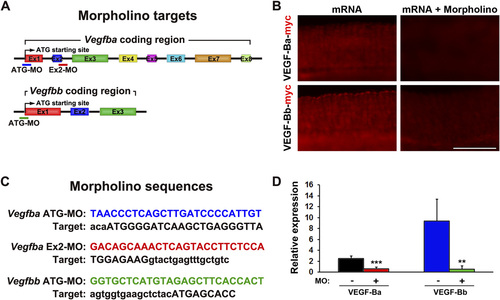
Morpholino designs and inhibitory efficacies. (A) Schematic representation of the coding sequence of the zebrafish Vegfba and Vegfbb genes. Morpholinos designed in this study were indicated. (B) Whole-mount immunohistochemical staining with an anti-Myc antibody of 24-hpf zebrafish embryos injected with 100 ng Vegfba:myc or Vegfbb:myc mRNAs with or without the corresponding ATG-blocking morpholinos. (Scale bar, 100 µm.) (C) Nucleotide sequences of Vegfb morpholinos and their targets. Lowercase letters in the targets indicate noncoding bases. (D) Quantification of anti-myc reactivity signals in 24-hpf zebrafish embryos injected with 100 ng Vegfba:myc or Vegfbb:myc mRNA with or without the corresponding ATG-blocking morpholinos (average: n = 18). **P < 0.01; ***P < 0.001. |
Differential effects of VEGF-Ba and VEGF-Aa on developmental angiogenesis in zebrafish embryos. (A) Confocal micrographs of 72-hpf fli1a:EGFP embryos injected with 0.6 pmol scrambled, Vegfba, and Vegfaa morpholinos. White arrows indicate brain vasculatures. Yellow arrows indicate ISVs. (Scale bar in overview, 500 µm; in brain and periphery, 50 µm.) (B) Quantification of the percentage of embryos with defective ISVs in 72-hpf fli1a:EGFP embryos injected with 0.6 pmol scrambled (Ctrl), Vegfba (Ba), or Vegfaa (Aa) morpholino (n = 7–14 embryos/group). ***P < 0.001. (C) Quantification of brain vessel density of 72-hpf fli1a:EGFP embryos injected with 0.6 pmol scrambled (Ctrl), Vegfba (Ba), and Vegfaa (Aa) morpholinos (n = 8–18 embryos/group). *P < 0.05; ***P < 0.001. |
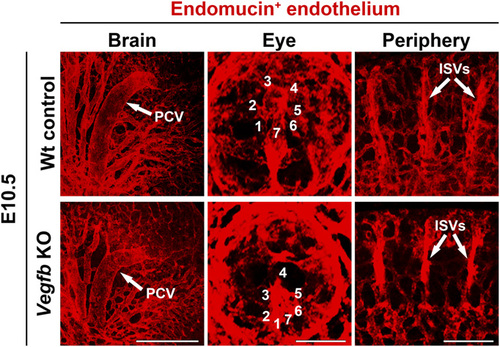
Vascular development in WT and Vegfb-deficient mice. Confocal micrographs of developing vasculatures in the brain, eye, and somites. PCV, posterior cerebral vessel. Positions of vascular branches from the central hyaloid vessels are numbered and correspond to hyaloid arterial branches in developing zebrafish embryos. (Scale bar in the brain, 500 µm; in the eye, 100 µm; in the periphery, 200 µm.) |