
Fig. 4
|
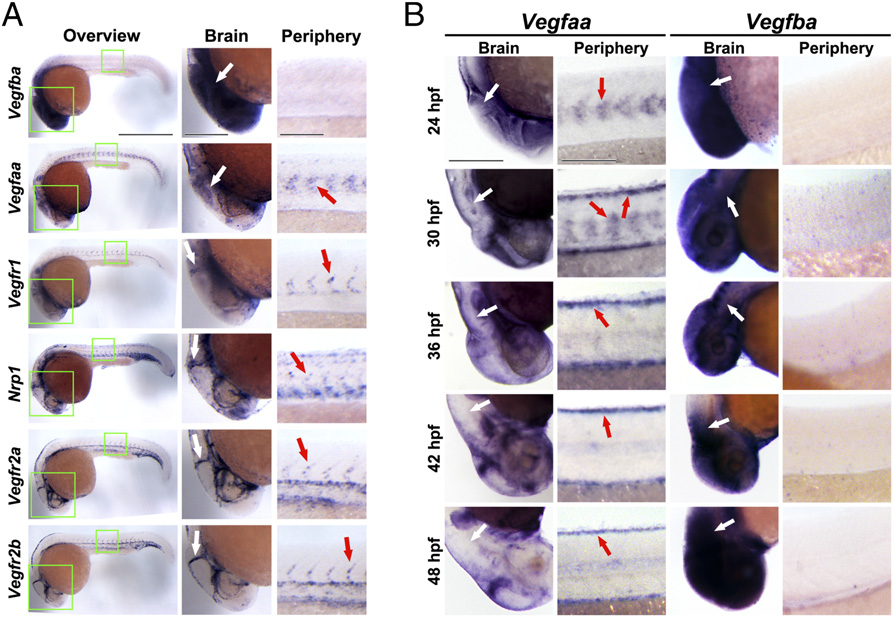
Fig. 4
mRNA expression levels of Vegfa, Vegfb, and Vegfrs in developing zebrafish embryos. (A) In situ hybridization micrographs of Vegfba, Vegfaa, Vegfr1, Nrp1, Vegfr2a, or Vegfr2b expression in 24-hpf zebrafish embryos. In situ positive signals are in dark blue. White arrows indicate MCVs (Vegfr1, Nrp1, Vegfr2a, and Vegfr2b images) or the MCV area (Vegfba and Vegfaa images). Red arrows indicate somites (Vegfaa) or ISVs. (Scale bar in overview: 500 µm; in brain: 200 µm; in periphery: 100 µm.) (B) In situ hybridization micrographs of Vegfba or Vegfaa expression in the brain or peripheral trunk regions of zebrafish embryos at 24, 30, 36, 42, or 48 hpf. In situ positive signals are in dark blue. White arrows indicate the MCV area. Red arrows indicate the peripheral expression-pattern of Vegfaa mRNA. (Scale bars in the brain, 200 µm; in periphery, 100 µm.)