
- Title
-
Spatio-Temporal Differences in Dystrophin Dynamics at mRNA and Protein Levels Revealed by a Novel FlipTrap Line
- Authors
- Ruf-Zamojski, F., Trivedi, V., Fraser, S.E., Trinh, L.A.
- Source
- Full text @ PLoS One
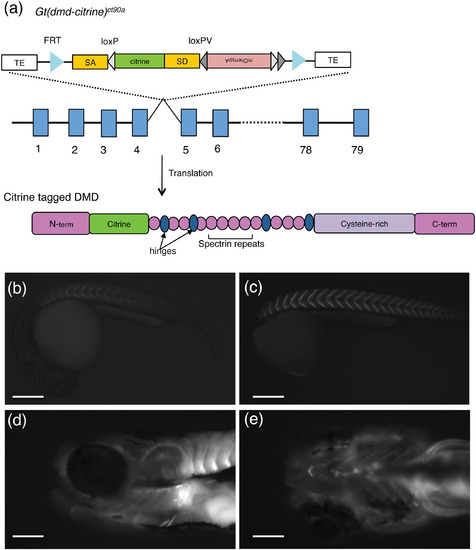
FlipTrap Gt(dmd-citrine)ct90a line allows visualization of Dmd protein. (a). Schematic of the FlipTrap vector inserted within dmd locus. Citrine insertion (green) occurs within intron 4–5 in dmd in the Gt(dmd-citrine)ct90a trap line (top) and upon translation produces a fluorescently tagged full-length functional Dmd protein (bottom). The exons (blue rectangles), introns (blank line) and domains of the protein are not drawn to scale. (b-e). Wide-field fluorescent images of Dmd-Citrine expression in the Gt(dmd-citrine)ct90a line, in the trunk skeletal muscles (b-c) at 24hpf (b) and 32hpf (c); (d-e). Expression in the cranial skeletal muscle at 6dpf (lateral (d) and ventral (e) views). Ventral view showing expression in the skeletal muscle of the branchial arches. Scale bars: (b)-(c) 100µm, (d)-(e) 25µm. |
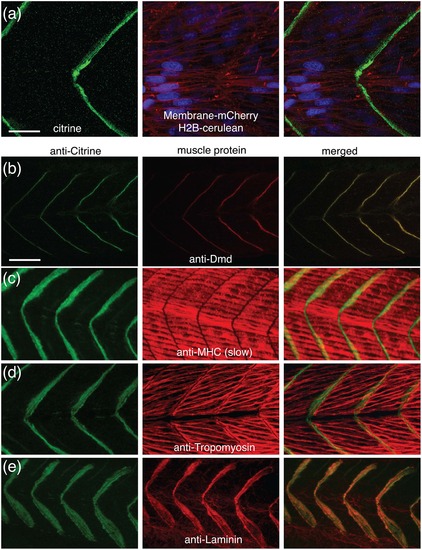
The Gt(dmd-citrine)ct90a trap line recapitulates endogenous Dmd protein expression. (a). Single optical section confocal images of live 30hpf ct90aGT embryo show that Dmd-citrine fusion protein is localized at the somite border. Dmd is in green (citrine), nuclei are in blue (H2B-cerulean), and membranes are in red (membrane-mCherry mRNA injected). (b). Antibody staining for Citrine and endogenous Dmd in the trap line confirms their co-localization at the somite border. Anti-Citrine label is in green and anti-Dmd label is in red. (c-f). Antibody staining for Citrine and endogenous muscle proteins. Myosin heavy chain (c) and Tropomyosin (d) are expressed in the muscle fibers while Laminin (e) localizes to the extracellular matrix of the myosepta. Scale bar = 10µm (a), 20µm (b). EXPRESSION / LABELING:
|
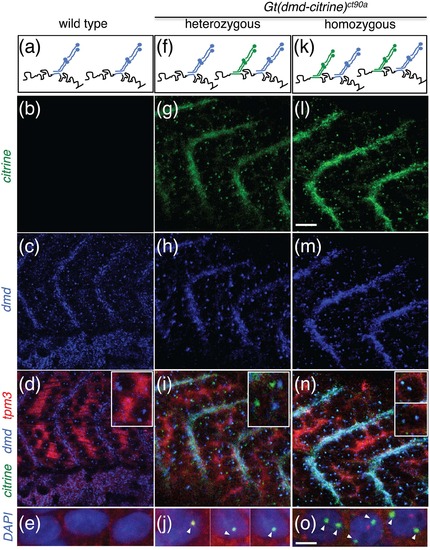
The Gt(dmd-citrine)ct90a trap line enables visualizing differential expression in homozygous and heterozygous embryos via in situ HCR. (a, f, k) Schematic of in situ HCR experiment showing dmd and citrine HCR probe binding sites within dmd and dmd-citrine transcript. The dmd HCR probe should bind to both dmd and dmd-citrine transcripts, while citrine HCR probe binds only to dmd-citrine transcript. (b-e, g-j, l-o). in situ HCR analysis of dmd (blue) and dmd-citrine (green) transcript in wild type (b-e), heterozygous (g-j) and homozygous (l-o) Gt(dmd-citrine)ct90a embryos. Tmp3 transcripts counter-stain muscles in red. Insets in (d),(i) and (n) show zoomed in view of transcription sites in the nuclei. Two dots are detected in homozygous embryos (k-n) whereas only one dot is detected in the nuclei of heterozygous ct90aGT embryos (f-i) while no citrine dots are detected in wild types embryos (a-d), consistent with the copy number of citrine inserted in the respective embryos. (e, j, o) Magnified images of the three types of embryos with nuclei stained in DAPI and the transcripts indicated by arrowheads. Scale bar (b-d, g-i, l-n)20µm (e,j,o)10µm. EXPRESSION / LABELING:
|
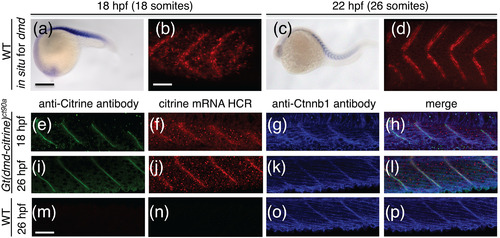
dmd mRNA and Dmd protein expression show differences in spatial expression. (a-d). Chromogenic in situ hybridization for dmd in wild type embryos at 18hpf (a,b) and 22hpf (c,d). (a,c) Wide field image of 18hpf and 22hpf embryos stained for dmd expression. (b,d) 3D projections of confocal z-stack of embryos in (a) and (c), respectively. Fluorescent signal of NBT/BCIP stain for dmd transcript reveals spatial confinement of transcript between somites. (e-p). Confocal image of dmd-citrine transcript (f,j,n) detected by in situ HCR and antibody staining for DMD-citrine protein (e,i,m) in Gt(dmd-citrine)ct90a (e-l) and wildtype (m-p) embryos at 18hpf and 26hpf. Counter-stain with antibody to Ctnnb1 in blue (g,k,o). (h,l,p) Merged of image of (e-g, i-k, and m-o). Comparison of protein and transcript expression at 18hpf (e-h) and 26 hpf (i-l) in Gt(dmd-citrine)ct90a embryos show that DMD protein localize exclusively to the myosepta while dmd-citrine mRNA is expressed in the cytoplasm at 18hpf and becomes more localized to the myosepta at 26hpf. Dmd-citrine expression in the nucleus can be seen as dots that appear similar in distribution between 18hpf and 26hpf. (m-p) DMD-citrine protein (m) and transcript (n) are not detected in wildtype embryos. Anti-Citrine antibody staining is in green, citrine mRNA HCR is in red and anti-Ctnnb1 antibody is in blue. Scale bars (a) 50µm (b,m) 20 µm. EXPRESSION / LABELING:
|
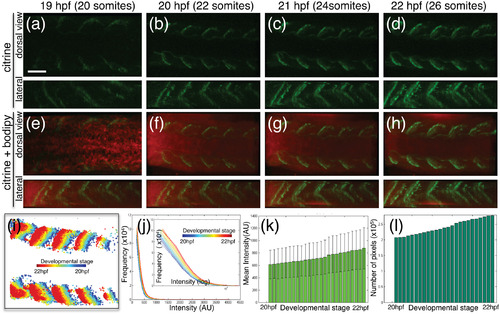
Dmd Protein expression increases both in intensity and area over development. (a-h). 3D projections of confocal Z-stacks images in developing trunk of Gt(dmd-citrine)ct90a embryos from the 20 to 26 somites stages (19–22 hpf), showing expression of Dmd-citrine (a-d, green) and the vital stain BodipyTR methyl ester (e-h, red) from dorsal and lateral view. (i-l) Quantitation of Dmd-citrine fluorescent signal in confocal time-lapse. (i). Kymograph of Dmd-citrine expression color-coded according to developmental stage. The spatial shift in expression appears to be due to tissue growth and expression enhancement over time. (j). Histogram of fluorescent pixel intensities color-coded according to developmental stage with intensity in X-axis and frequency in Y-axis. Plot shows Dmd-citrine expression increasing over time resulting in shift slope along the X-axis (blue to red). The inset shows the same plotted on a log scale to enhance observation. (k). Mean pixel intensity plotted against development stage showing increase in fluorescent intensity of Dmd-citrine as development progresses. The error bars denote the variation among all the pixels at that particular stage. (l). Total pixel count of Dmd-citrine fluorescent plotted against developmental time showing that Dmd-citrine expression increase in spatial area over time. Scale bar = 20µm. EXPRESSION / LABELING:
|
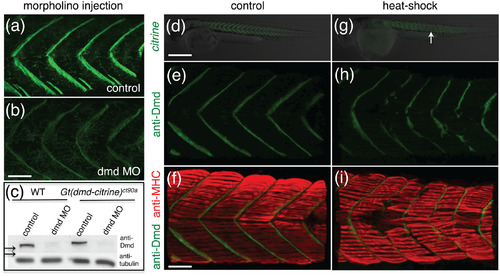
Phenotyping of muscular dystrophy with Gt(dmd-citrine)ct90a. (a,b). Dmd-citrine expression in control (a) and dmd morphants (b). Embryos in (a) and (b) were imaged with the same laser power and gain settings. (c) Western-blot of protein extracts from WT (lanes 1, 2) and Gt(dmd-citrine)ct90a (lanes 3, 4) embryos with antibody to DMD and tubulin (loading control). Embryos for protein extracts were injected with control morpholino (lanes 1 and 3) and dmd morpholino (lanes 2 and 4, n = 3–6). Arrows point to size difference between Dmd and Dmd-citrine. (d,e) Widefield fluorescent image of 32hpf ct90aGT embryos untreated (d) and treated with heat-shocked at 6-somites stage. Arrow point to defects in Dmd-citrine expression visible between somites 16–25. (f-i) Heat-shocked embryos stained for Dmd (f,g; green) and anti-MHC (h,i; red) at 32hpf. Scale bars (d,e) 50µm (f-i) 20 µm. EXPRESSION / LABELING:
PHENOTYPE:
|
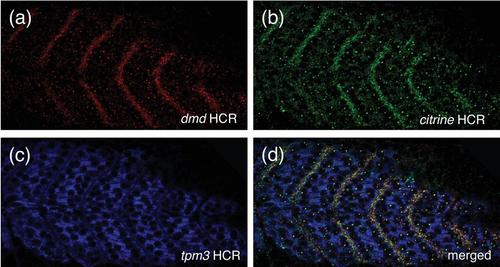
Co-localization of dmd and dmd-citrine transcript in Gt(dmd-citrine)ct90a embryos via in situ HCR. (a-c) in situ HCR of dmd (red), citrine (green) and tpm3 in Gt(dmd-citrine)ct90a embryos. Tpm3 labels the cytoplasm of the myocytes while both dmd and citrine are detected at the myosepta and in the nucleus. Dmd and citrine transcripts show overlap expression at the myosepta. (d) Merge of (a-c). |
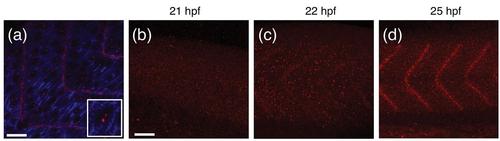
Differential localization of dmd transcript over developmental time as detected via in situ HCR. (a) in situ HCR of dmd-citrine (red) in ct90aGT embryos counter-stained for tpm3 (blue). tpm3 Counter-stain show the nuclei by negative contrast. Inset shows zoomed in view of active transcription sites in the nuclei. (b-d) 3D projections of confocal z-stacks of dmd transcripts stained by in situ HCR at 21hpf (b), 22hpf (c), and 25hpf (d). dmd transcript transitions from the entire somite to the somite boundaries as development progresses. |
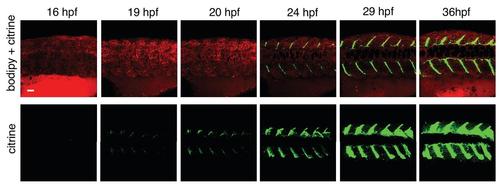
Time lapse imaging of Dmd-citrine expression in Gt(dmd-citrine)ct90a trap line. 3D projections of confocal Z-stacks images in developing trunk of Gt(dmd-citrine)ct90a embryos from the 18 to 35 hpf, showing expression of Dmd-citrine (green) and the vitalstain BodipyTR methyl ester (red) from dorsal view. The expression of Dmd-Citrinefusion (green) increases with development. The microscope gain has been kept high inorder to detect citrine expression as early as possible. Images taken from frames withinSupplemental movie 1. Scale bar = 20µm |