
FIGURE
Fig. S2
Fig. S2
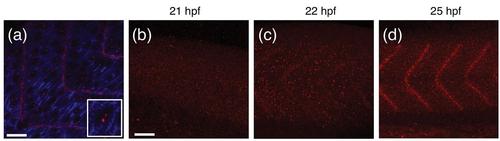
Differential localization of dmd transcript over developmental time as detected via in situ HCR. (a) in situ HCR of dmd-citrine (red) in ct90aGT embryos counter-stained for tpm3 (blue). tpm3 Counter-stain show the nuclei by negative contrast. Inset shows zoomed in view of active transcription sites in the nuclei. (b-d) 3D projections of confocal z-stacks of dmd transcripts stained by in situ HCR at 21hpf (b), 22hpf (c), and 25hpf (d). dmd transcript transitions from the entire somite to the somite boundaries as development progresses. |
Expression Data
Expression Detail
Antibody Labeling
Phenotype Data
Phenotype Detail
Acknowledgments
This image is the copyrighted work of the attributed author or publisher, and
ZFIN has permission only to display this image to its users.
Additional permissions should be obtained from the applicable author or publisher of the image.
Full text @ PLoS One