
FIGURE
Fig. S3
Fig. S3
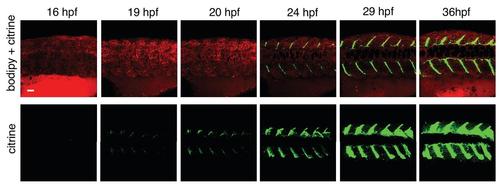
Time lapse imaging of Dmd-citrine expression in Gt(dmd-citrine)ct90a trap line. 3D projections of confocal Z-stacks images in developing trunk of Gt(dmd-citrine)ct90a embryos from the 18 to 35 hpf, showing expression of Dmd-citrine (green) and the vitalstain BodipyTR methyl ester (red) from dorsal view. The expression of Dmd-Citrinefusion (green) increases with development. The microscope gain has been kept high inorder to detect citrine expression as early as possible. Images taken from frames withinSupplemental movie 1. Scale bar = 20µm |
Expression Data
Expression Detail
Antibody Labeling
Phenotype Data
Phenotype Detail
Acknowledgments
This image is the copyrighted work of the attributed author or publisher, and
ZFIN has permission only to display this image to its users.
Additional permissions should be obtained from the applicable author or publisher of the image.
Full text @ PLoS One