
|
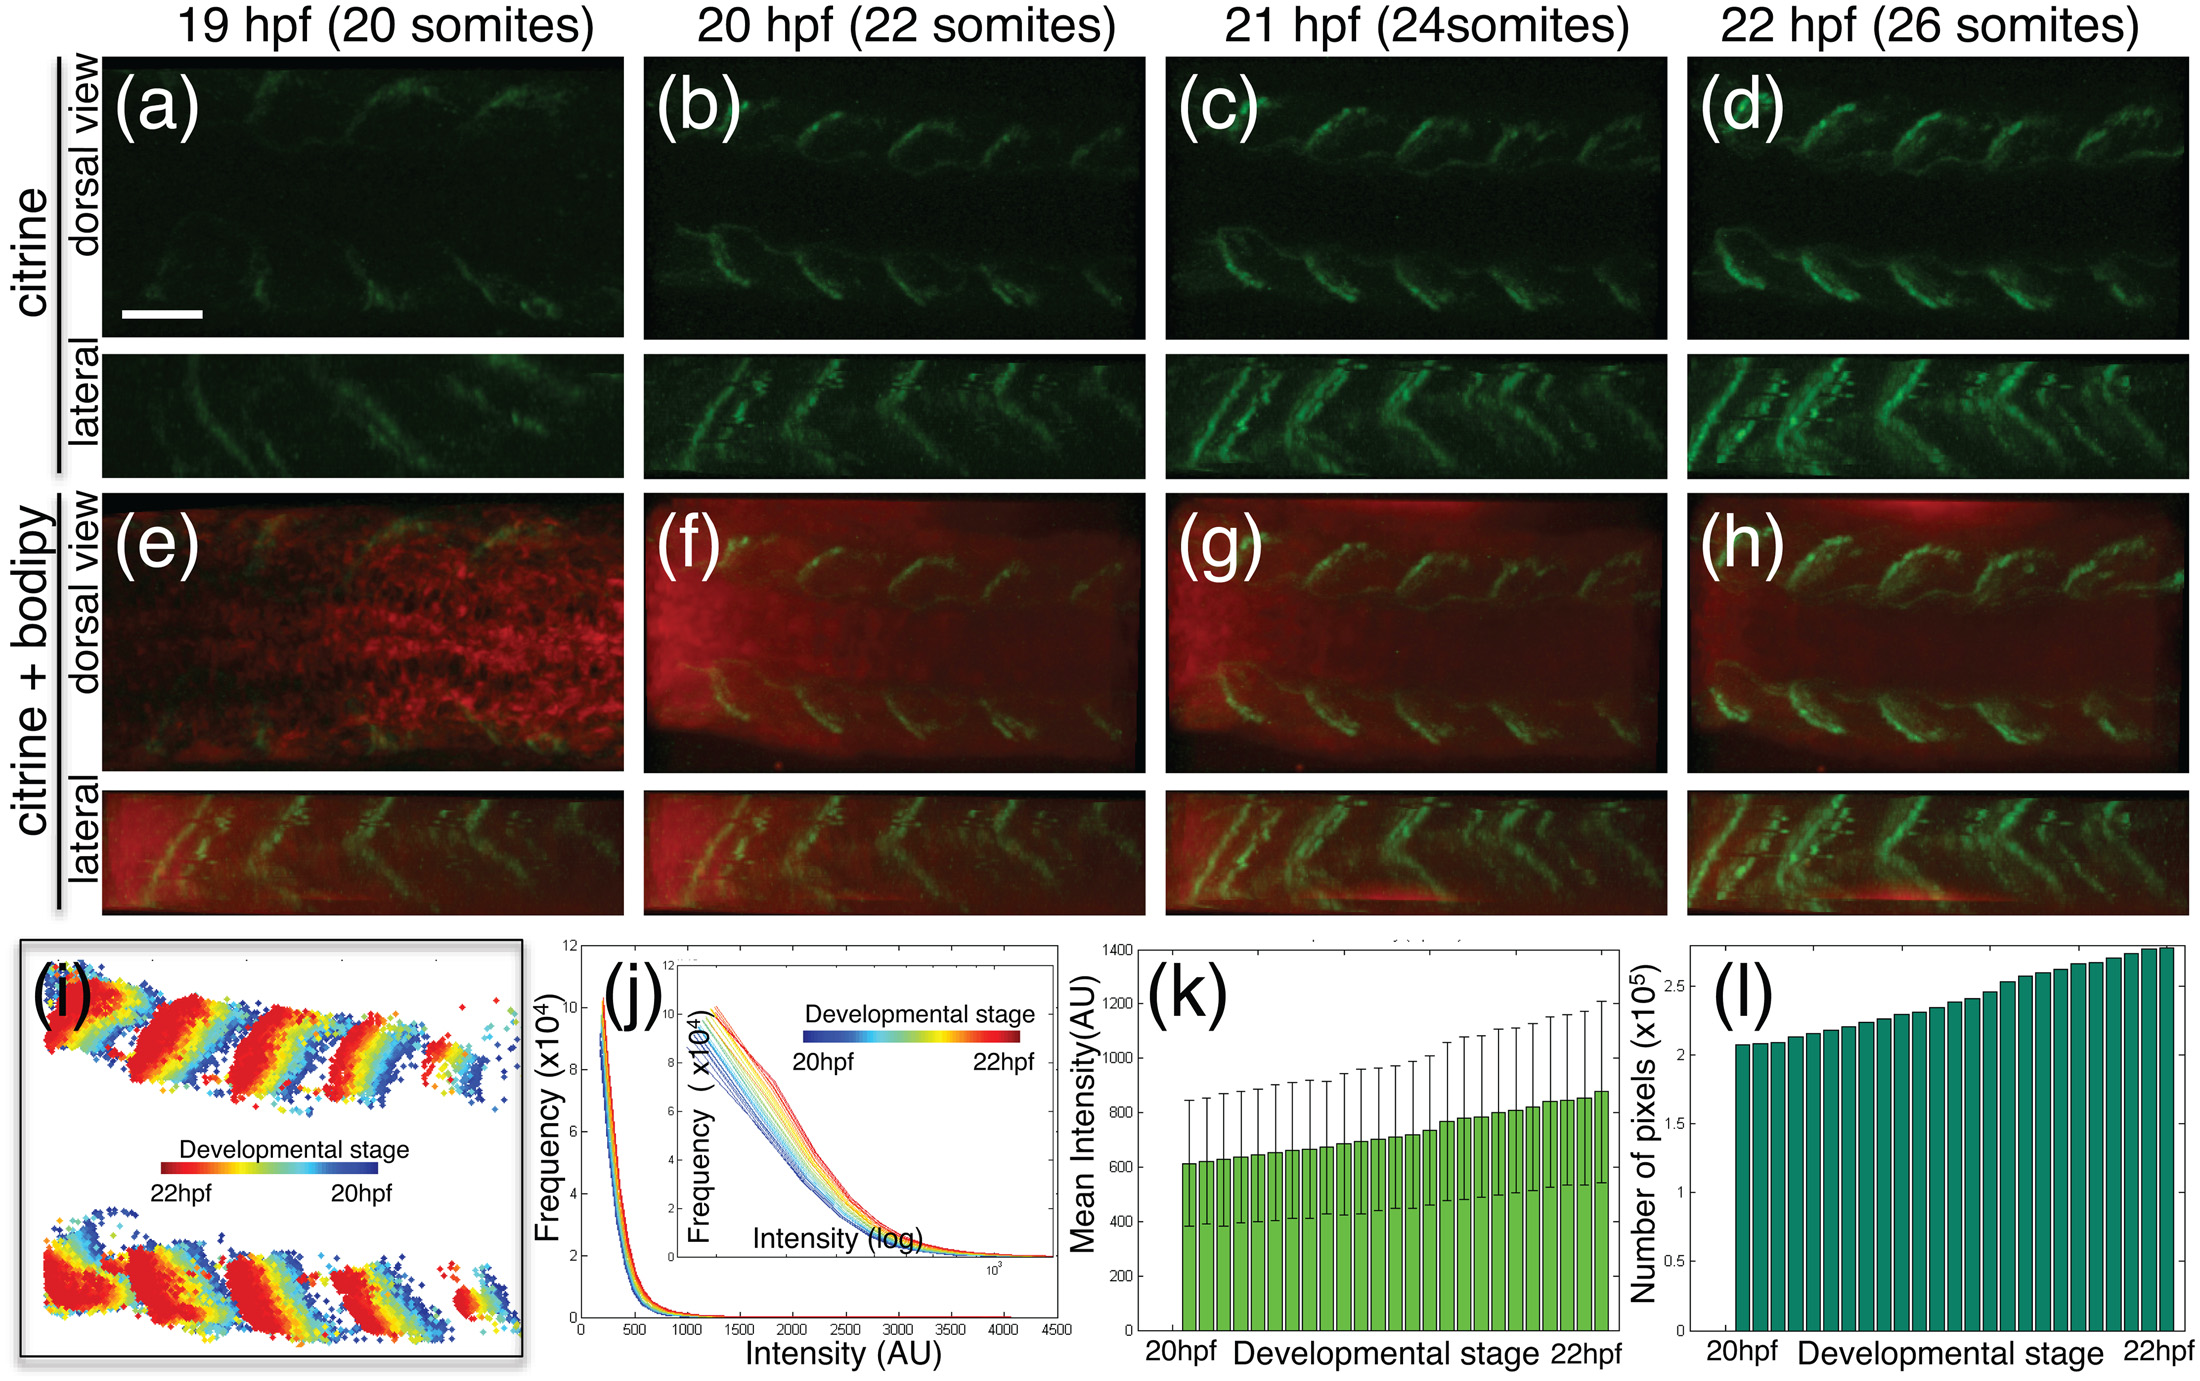
Fig. 5 Dmd Protein expression increases both in intensity and area over development.
(a-h). 3D projections of confocal Z-stacks images in developing trunk of Gt(dmd-citrine)ct90a embryos from the 20 to 26 somites stages (19–22 hpf), showing expression of Dmd-citrine (a-d, green) and the vital stain BodipyTR methyl ester (e-h, red) from dorsal and lateral view. (i-l) Quantitation of Dmd-citrine fluorescent signal in confocal time-lapse. (i). Kymograph of Dmd-citrine expression color-coded according to developmental stage. The spatial shift in expression appears to be due to tissue growth and expression enhancement over time. (j). Histogram of fluorescent pixel intensities color-coded according to developmental stage with intensity in X-axis and frequency in Y-axis. Plot shows Dmd-citrine expression increasing over time resulting in shift slope along the X-axis (blue to red). The inset shows the same plotted on a log scale to enhance observation. (k). Mean pixel intensity plotted against development stage showing increase in fluorescent intensity of Dmd-citrine as development progresses. The error bars denote the variation among all the pixels at that particular stage. (l). Total pixel count of Dmd-citrine fluorescent plotted against developmental time showing that Dmd-citrine expression increase in spatial area over time. Scale bar = 20µm.