
|
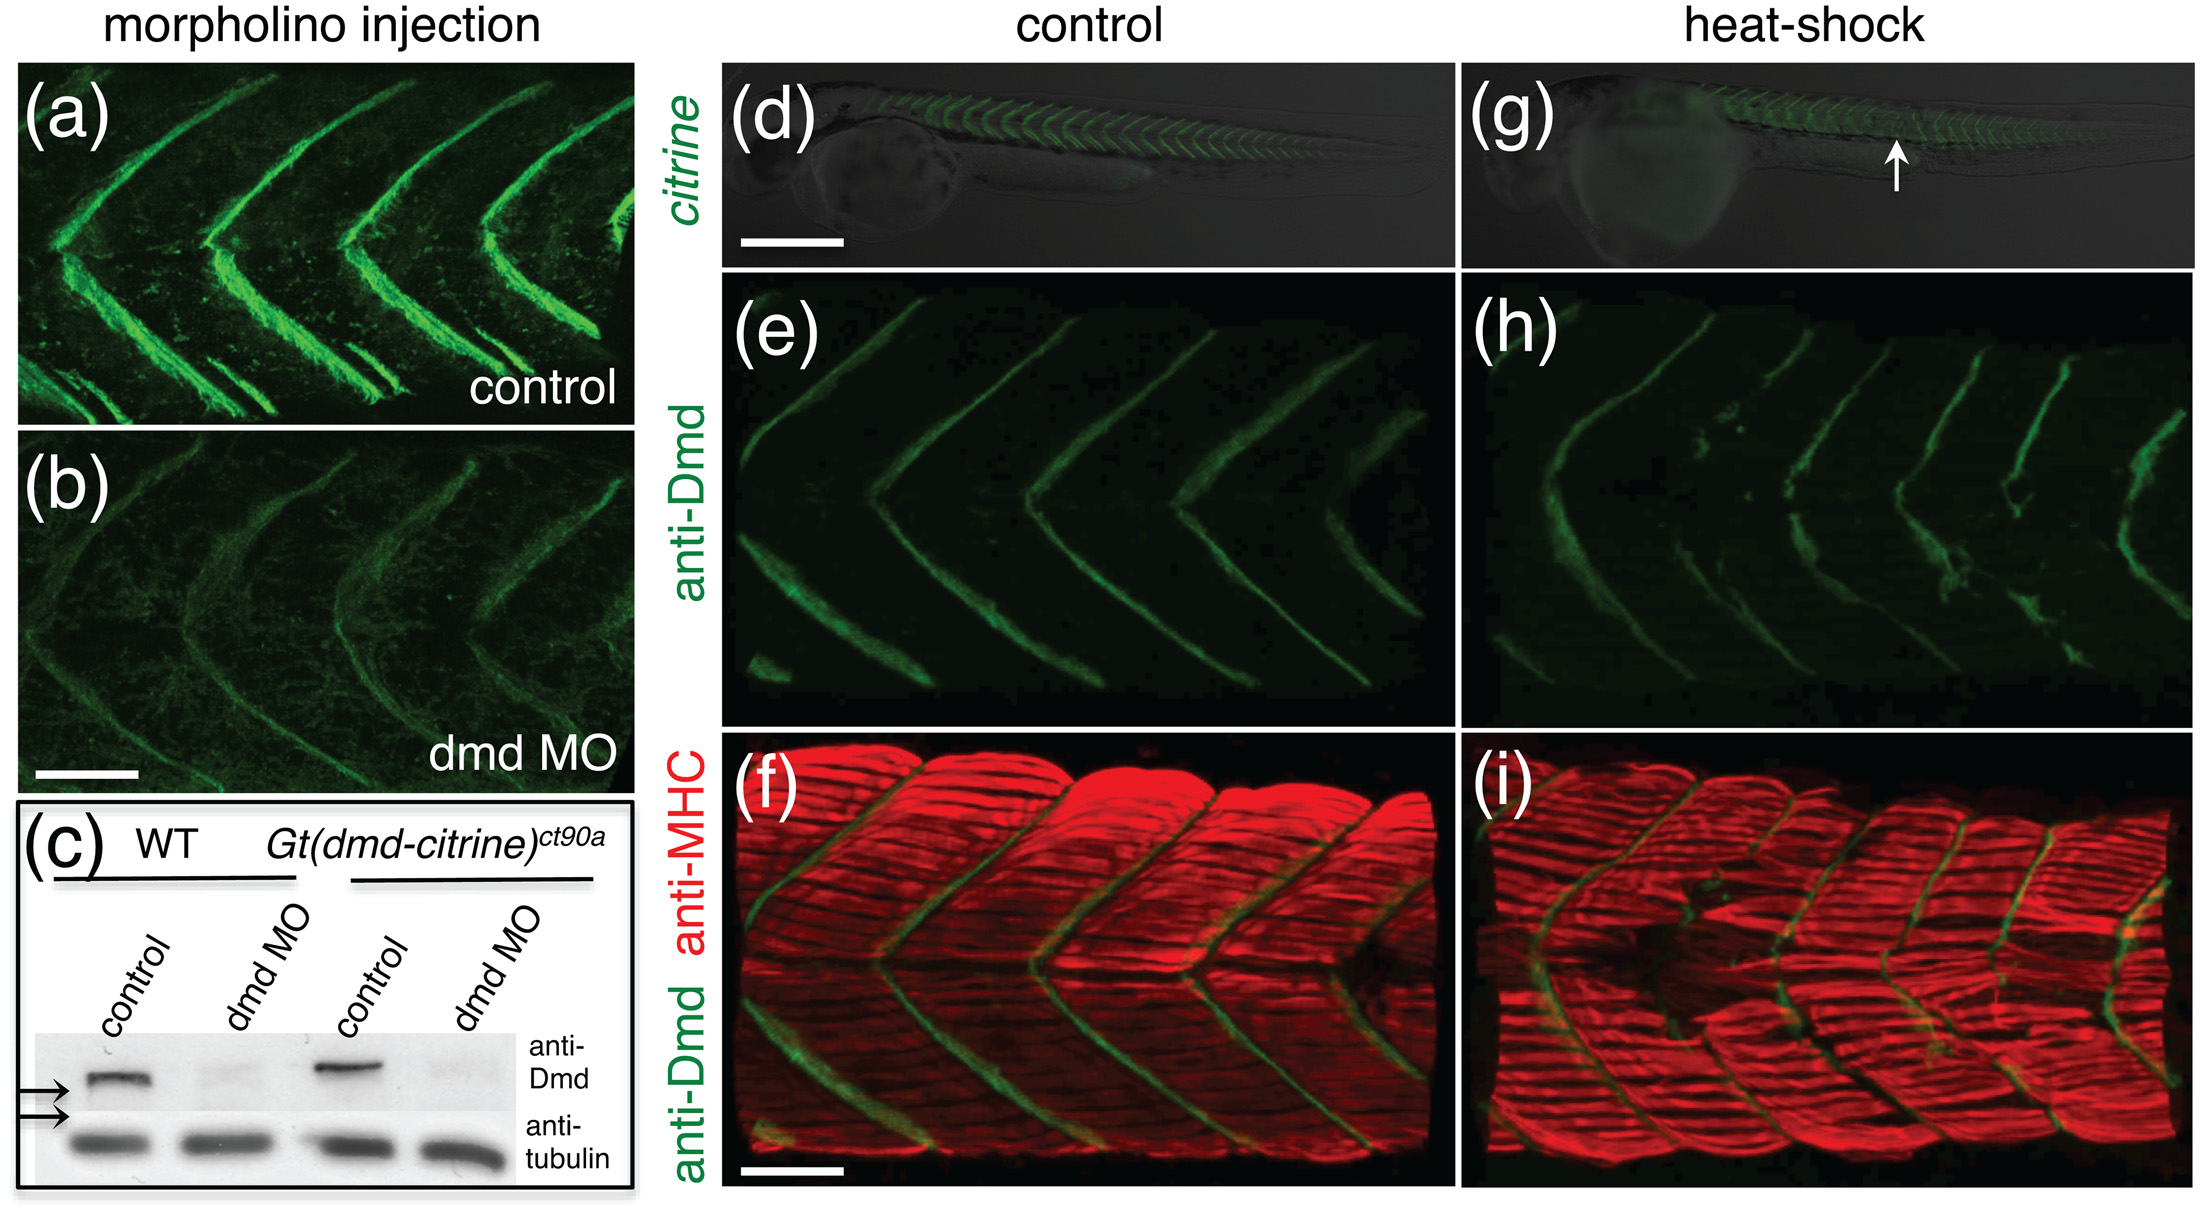
Fig. 6 Phenotyping of muscular dystrophy with Gt(dmd-citrine)ct90a.
(a,b). Dmd-citrine expression in control (a) and dmd morphants (b). Embryos in (a) and (b) were imaged with the same laser power and gain settings. (c) Western-blot of protein extracts from WT (lanes 1, 2) and Gt(dmd-citrine)ct90a (lanes 3, 4) embryos with antibody to DMD and tubulin (loading control). Embryos for protein extracts were injected with control morpholino (lanes 1 and 3) and dmd morpholino (lanes 2 and 4, n = 3–6). Arrows point to size difference between Dmd and Dmd-citrine. (d,e) Widefield fluorescent image of 32hpf ct90aGT embryos untreated (d) and treated with heat-shocked at 6-somites stage. Arrow point to defects in Dmd-citrine expression visible between somites 16–25. (f-i) Heat-shocked embryos stained for Dmd (f,g; green) and anti-MHC (h,i; red) at 32hpf. Scale bars (d,e) 50µm (f-i) 20 µm.