
- Title
-
Denervation impairs regeneration of amputated zebrafish fins
- Authors
- Simões, M.G., Bensimon-Brito, A., Fonseca, M., Farinho, A., Valério, F., Sousa, S., Kumar, A., Jacinto, A.
- Source
- Full text @ BMC Dev. Biol.
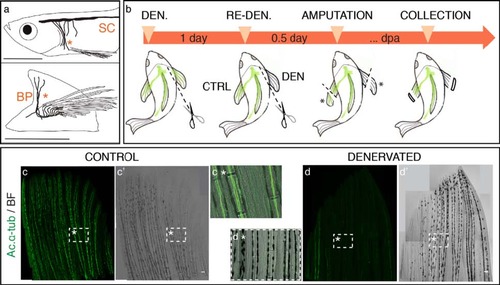
Adult zebrafish pectoral fin denervation assay. a) Pectoral fin innervation. The zebrafish pectoral fin is innervated by both sensory and motor nerves that descend from the spinal cord (SC) and enter the pectoral fin region medially, as a combined brachial plexus (BP) (*). Sensory and motor axons then branch to serve the pectoral muscles and fin rays. Sensorial nerves run both along the intra and inter-ray regions (adapted from [38],[39). b) Denervation assay. The right pectoral fin was denervated (DEN) by transecting the nerve fibres in the brachial plexus region, while the left fin served as an innervated control (CTRL). In the next day, the right fin was re-denervated to assure total nerve degeneration. After 6–8 hours both fins were amputated and the discarded tissue (*) was collected for ac. α-tub staining. Fish were placed in 33°C water tanks and regeneration was allowed to proceed. Re-denervation took place every day after amputation, to avoid nerve recovery. Regenerates were collected for further analysis at specific time points post-amputation. c,d) Pectoral fin denervation efficiency. Staining for ac. α-tub in whole mount fins shows that nerve ablation at the level of the brachial plexus is efficient to deprive pectoral fins from its innervation. An innervated control fin (c,c′), with bundles of axons running in the inter and intra-ray region (c* - magnification of the boxed region in c), contrasts with a denervated fin (d,d′), with fewer or any presence of the axonal marker ac. α-tub, inside and outside bony rays (d*- magnification of the boxed region in d). The images are a projection of confocal optical slices. Scale bar - 100 µm. |
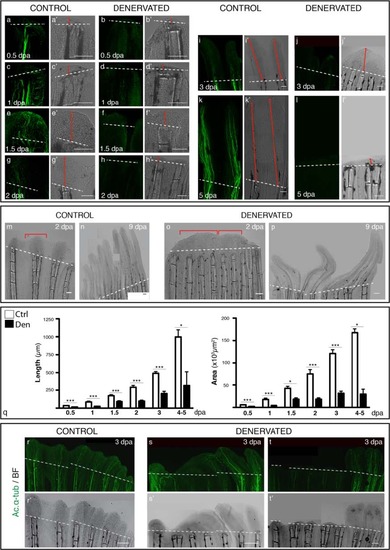
Analysis of pectoral fin regeneration, upon denervation. a-l) Staining for ac. α-tub in whole mount fins confirms the absense of nerve fibres at the amputation site of denervated fins. Brightfield images demonstrate the difference in the extent of regeneration among fins (a′-l′). At 0.5 and 1 dpa denervated fins (b,d) have a WE that is thinner than controls (a,c). From 1.5 to 5 dpa, denervated fins are not able to form a normal blastema and regenerate (f,h,j,l). In some cases the blastema is completely absent (h′,l′), while in others a smaller and defective blastema is formed and fins regenerate partially (f′,j′). Red arrowed solid lines indicate regenerated tissue length. m-p) Defective denervated regenerating fins. Denervated fins regenerate defectively and form “merged blastemas” on adjacent rays. The “wavy” appearance of new control fins, where each ray has its own cone shaped blastema (m-bracket), contrasts with denervated fins, where apparently several rays share a single, merged blastema (obracket). At 9 dpa denervated fins with a similar extent of regeneration as the controls (n), present a defective patterning (p). q) Quantification of the area and length of regenerated tissue. Measurements taken from the amputation site to the most distal tip reveal a consistent significant reduction (***p < 0.0001, *p < 0.05) of denervated fins in relation to controls. r-t) Influence of nerve quantity in fin regeneration. Staining for ac. α-tub. in whole mount fins at 3 dpa show equal innervation and regeneration of control rays within the same fin (r), while denervated fins, the rays with less or no innervation present less or no regeneration (s,t), suggesting that the success of regeneration depends on the quanity of innervation for each ray. a-q and s-t) The images are a projection of confocal optical slices. Dashed lines mark amputation plane. Scale bar - 100 &3181;m. |
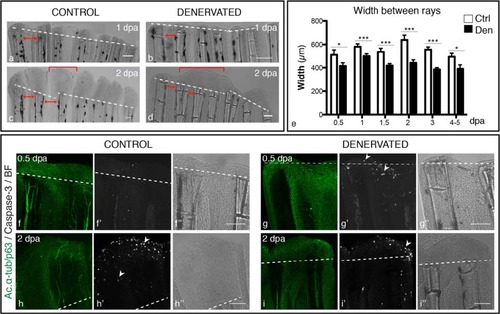
Width of regenerated fins, upon denervation. a-d) Brightfield images show that the inter-ray region of denervated fins is reduced in relation to controls. Additionally, “merged blastemas” (bracket) are observed on consecutive rays at 2 dpa (d), in contrast to single-ray blastemas found in control fins (c). Solid red arrowed lines indicate the inter-ray width. e) Quantification of inter-ray width. Measurements of rays and inter-ray units show that width of denervated fins is significantly smaller than that of the controls (***p < 0.0001, *p < 0.05). f-i) Apoptosis in whole mount amputated fins. Staining for activated caspase3 and ac. α-tub/p63 in whole mount fins activity reveals an increase in apoptotic cells in the WE and in the inter-ray region (arrowhead) of denervated fins, during the first day after amputation (g′). At 2 dpa, activated caspase-3 is expressed in the epidermis of both control (h′) and denervated and fins (i′). a-d, f-i) The images are a projection of confocal optical slices. Dashed lines mark amputation plane. Scale bar - 100 µm. |
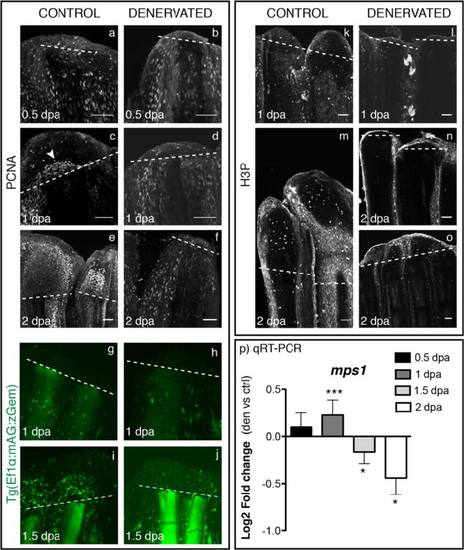
Analysis of cell cycle markers in mesenchymal cells, upon denervation. a-f) Staining for PCNA in whole mount fins shows equal expression in epidermal and mesenchymal cells of both control and denervated fins at 0.5 dpa (a,b). At 1 dpa, PCNA-positive cells start to accumulate at the level of amputation in the region that will give rise to the blastema in control fins (c - arrowhead), which is not observed in denervated fins (d). At 2 dpa control fins show an accumulation of PCNA-positive cells in the blastema region (e), while denervated fins resemble as 0.5 dpa fins (f). g-j) Live imaging with the Tg(Ef1α:mAG:zGem). At 1 dpa Geminin-positive cells are equally expressed in control (g) and denervated fins (h). GFP nuclei started to be evident in the mesenchyme above the amputation plane of control fins at 1.5 dpa (i), but not in the denervated ones (j). k-o) Staining for H3P in whole mount fins. H3P starts to be expressed at 1 dpa in some mesenchymal cells of control fins (k). At 2 dpa H3P-positive cells are present only in control fins (m) and in reduced number in partially regenerating denervated fins (o). Note: H3P has a non-specific label in distal epidermal cells, as previously reported 42]. a-o) The images are a projection of confocal optical slices. Dashed lines mark amputation plane. Scale bar - 50 µm. p) qRT-PCR formps1. Mps1 levels of expression increase in denervated fins at 1 dpa and decrease at 1.5 and 2 dpa, in relation to controls (***p < 0.0001, *p < 0.05). |
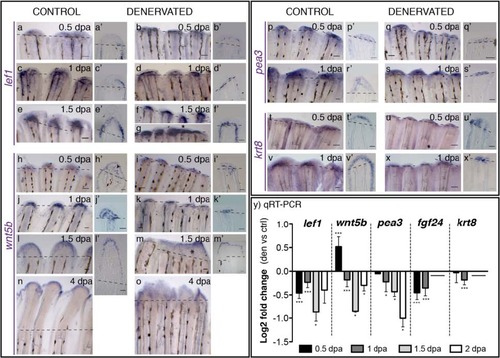
Gene expression in the WE of control and denervated fins. a-x) mRNA ISH on whole mount amputated fins: lef1, wnt5b, pea3, krt8. a′-x′) Longitudinal sections of the rays using whole mount ISH. a-g)Lef1 is expressed from 0.5 to 1.5 dpa in the BEL of both control (a,c,e) and denervated fins (b,d,f,g). At 1.5 dpa lef1 is expressed in the inter-ray region of non-regenerating (f) and partially regenerating denervated fins, where it forms what seems a shared BEL on contiguous rays (g*). h-o)Wnt5b is expressed in the WE of both control (h,j,l,n) and denervated fins (i,k,m,o) from 0.5 to 4 dpa. [The arrowhead in h′ indicates expression, staining in the WE is an artefact]. In denervated fins, after 1.5 dpa, wnt5b presents a spread and de-regulated expression domain (m). p-s)Pea3 is expressed in both control and denervated fins at 0.5 and 1 dpa, with a reduced expression in denervated fins (q,s). In controls pea3 is expressed in the whole WE (p′,r′), while in denervates is restricted to the distal WE cells (q′,s′). t-x)Krt8 is expressed in both control (t,v) and denervated fins (u,x) at 0.5 and 1 dpa, with a reduced expression in denervates (u,x). While in controls krt8 is strongly expressed in the whole WE (t′,v′), in denervates it is restricted to some epidermal cells in the distal tip (u′,x′). a,a′-x,x′) Dashed lines mark amputation plane. Scale bar - 100 µm in whole mount; 25 µm in sections. y) qRT-PCR for genes expressed in the WE. qRT-PCR analysis shows a decrease in the expression levels of analysed genes on denervated fins, in relation to controls, from 0.5 to 2 dpa, except for wnt5b, which is increased at 0.5 dpa. Note: ***p < 0.0001, *p < 0.05. Data not evaluated for krt8 and fgf24, at 1.5 and 2 dpa. |
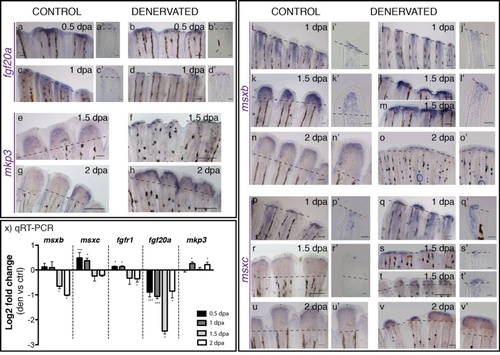
Gene expression in the blastema of control and denervated fins. a-v) mRNA ISH on whole mount amputated fins: fgf20a, mkp3, msxb, msxc.a′-l′, p′-t′) Longitudinal sections of the rays using whole mount ISH. a-d)Fgf20a expression is detected at 0.5 and 1 dpa in control fins (a,c) and only a residual expression is detected in denervated fins (b,d). e-k)Mkp3 is detected at 1.5 dpa in control (e) and denervated fins (f). At 2 dpa the expression in denervated fins is reduced but stronger (h) than in controls (g). i-o)Msxb expression starts at 1 dpa in both control and denervated fins. At 1.5 dpa denervated rays that have partially regenerated (m) present msxb expression spread in the inter-ray tissue (*). msxb expression is still detected at 2 dpa, however, in denervated fins is reduced to a thin domain (o). p-v)Msxc expression is present in both fins at 1 dpa, but with a stronger expression in denervated fins (q,q′). Expression is maintained after 1.5 dpa in non-regenerating (s,s′) and partially regenerating fins (t,t′). At 2 dpa, msxc is expressed as a continuum in the tip of partially regenerating denervated fins, in what seems a “merged blastema” (Adult zebrafish pectoral fin denervation assay.,v′). a,a′-v,v′) Dashed lines mark amputation plane. Scale bar - 100 µm in whole mount fins; 25 µm in sections. x) qRT-PCR for genes expressed in the blastema. qRT-PCR analysis shows an increase in the expression of msxc and fgfr1 on denervated fins at 0.5 and 1 dpa, as well as in mkp3 at 1 and 2 dpa, when compared to controls. Fgf20a levels of expression are always decreased in relation to the controls, as it is msxb at 1.5 and 2 dpa. Note: ***p < 0.0001, *p < 0.05. |
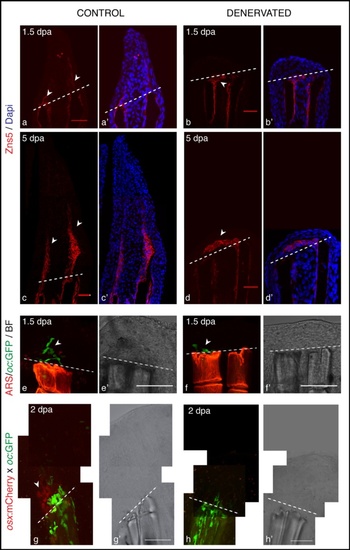
Scleroblasts alignment in amputated fins, upon denervation. a-d) Staining for Zns5 and DAPI in longitudinal sections shows that between 1 and 1.5 dpa, Zns5-positive cells start to accumulate just distal to the amputation plane in control fins (a-arrowhead). However, in denervated fins scleroblasts are not aligned with the stump rays, but instead are deposited between the 2 hemi-rays (b-arrowhead). At later time points the scleroblast deposition covers the tip of denervated rays (d). e,f) Live imaging with the Tg (oc:GFP) co-stained with Alizarin red-S (ARS). In vivo imaging of Tg (oc:GFP) stained with ARS shows that mature bone cells (oc-positive) of control fins are localized at the amputation level and in the blastema (e-arrowhead). However, in denervated fins oc-positive cells do not migrate further than the amputation plane (f-arrowhead). g,h) Live imaging with the transgenics Tg (oc:GFP), Tg (osx:mCherry) and ARS. Zebrafish transgenic line resulting from an outcross between Tg(oc:GFP) and Tg(osx:mCherry) shows that at 2 dpa only control fins present oc-positive and osx-positive cells in the blastema (g-arrowhead). a-h) The images are a projection of confocal optical slices. Dashed lines mark amputation plane. a-d) Scale bar - 25 µm. e-h) Scale bar - 100 µm. |
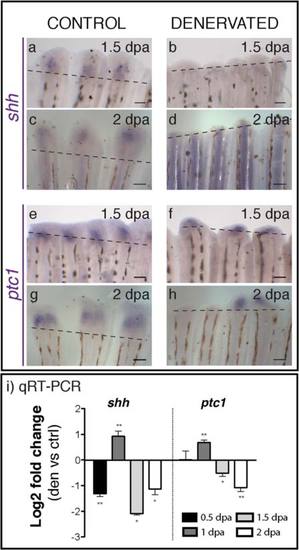
Shhandptc1expression in control and denervated fins. a-h) mRNA ISH on whole mount amputated fins. Shh expression is first detected at 1.5 dpa in the blastema of control fins (a), but not in the denervated ones (b). Ptc1 mRNA starts to be expressed in the stump at 1 dpa both in control (e) and denervated fins (f). While in control fins ptc1 is expressed in every ray at 2 dpa, in denervated fins it is expressed only in the rays with a small blastema (h). a-h) Dashed lines mark amputation plane. Scale bar - 100 µm. i) qRT-PCR for shh and ptc1. qRT-PCR reveals lower levels of shh expression on denervated fins in relation to controls, at 0.5 dpa. These levels abruptly increase at 1 dpa, decreasing again at 1.5 and 2 dpa. Ptc1 expression is also higher at 1 dpa and lower at 1.5 and 2 dpa on denervated fins, in relation to controls (**p < 0.001, *p < 0.05). |
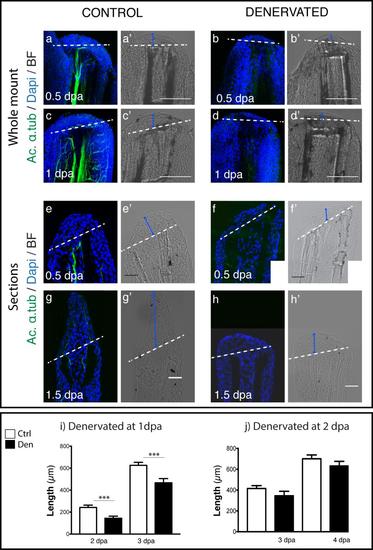
Analysis of the regenerative process of denervated pectoral fins. a-d) Staining for ac. α-tub and DAPI in whole mount fins. Staining with DAPI confirms that fins without innervation (b,d) have a WE with less epidermal cell layers than controls (a,c). e-h) Staining for ac. α-tub and DAPI in sections. Staining with DAPI shows that fins without innervation (e) have a WE with less epidermal cell layers than controls (f). After 1.5 dpa denervated fins (h) are not able to regenerate as the controls (g). a-h) Dashed lines mark amputation plane. i,j) Quantification of the length of regenerated tissue in fins denervated after amputation. Measurements of the length of regenerated tissue, taken from the amputation site to the most distal tip. i) There is a consistent significant reduction (***p < 0.0001) in the length of fins denervated at 1 dpa in relation to controls, both at 2 and 3 dpa. j) There is no significant reduction in the length of regenerates in fins denervated at 2dpa in relation to controls (fix at 3 dpa p = 0.33; fix at 4 dpa p = 0.07). |
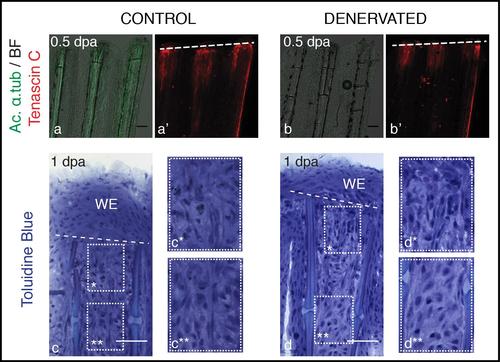
Mesenchymal tissue disorganization after amputation of denervated fins. a,b) Staining for Tenascin C and ac. α-tub in whole mount fins at 0.5 dpa. Tenascin C is present in the mesenchymal tissue under the amputation plane, both in control and denervated fins. c,d) Toluidine Blue histology in longitudinal sections. Longitudinal sections stained with toluidine blue show that at 1 dpa mesenchymal tissue becomes more disorganised below the amputation plane, with cells presenting a more elongated shape that suggests cell migration, in both control (c*) and denervated fins (d*), while more proximal mesenchymal tissue presents a more organized structure (c**, d**). a-d) The images are a projection of confocal optical slices. Dashed lines mark amputation plane. a,b) Scale bar - 100 µm. c,d) Scale bar - 50 µm. |
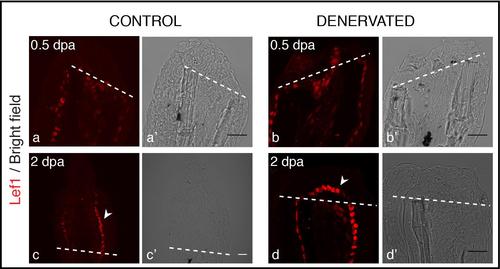
Staining for Lef1 in longitudinal sections after amputation of denervated fins. Lef1 protein is detected in the BEL of both control and denervated fins from 0.5 to 2 dpa. At 0.5 dpa Lef1 expression is similar in control (a) and denervated (b) fins. At 2 dpa Lef1 is restricted to the most proximal BEL cells in control fins (c-arrowhead) and it is expressed all over the BEL lining mesenchymal cells of denervated fins (d-arrowhead). Scale bar - 25 µm. a-d) The images are a projection of confocal optical slices. Dashed lines mark amputation plane. Scale bar - 25 µm. |
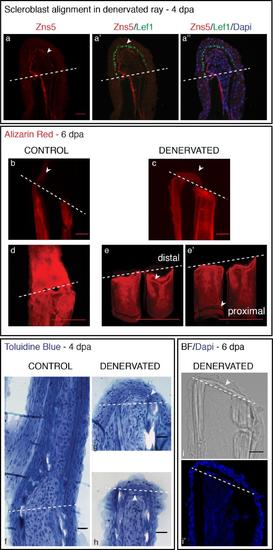
Bone deposition in the amputation plane of denervated fins. a) Staining in longitudinal sections for Zns5, Lef1 and DAPI. Zns5-positive cells accumulate below the BEL of denervated fins, forming an arch that delimits mesenchymal cells. Lef1 is ectopically expressed in the whole BEL (a′). b,c) Staining with ARS in longitudinal sections. Alizarin Red staining at 6 dpa shows mineralization of the newly formed ray along the old bony ray in control fins (b-arrowhead), while in denervated fins it shows bone deposition in at the amputation level (c -arrowhead). d,e) Staining with ARS in whole mount fins. The deposition of bone cells in the amputation site causes a thickening in the distal stump of deneravated fins. A 3D projection of denervated rays shows that the distal region (e-arrowhead) is comparatively thicker in relation to the proximal region (e′-arrowhead). f-h) Toluidine Blue histology in longitudinal sections. At 4 dpa cell deposition between the 2 hemi-rays is observed in denervated fins (g,h). The new structure resembling bone matrix seems to be derived from the old bone (g - arrowhead) and a group of cells, resembling bone cells, are deposited at the level of amputation almost closing the ray (h - arrowhead). i) DAPI staining in longitudinal sections. At 6 dpa a bright field image shows matrix deposition at the level of amputation between the two hemi-rays (arrowhead). a-e, i) The images are a projection of confocal optical slices. Dashed lines mark amputation plane. a,e) Scale bar - 25 µm. b-d) Scale bar - 50 µm. |
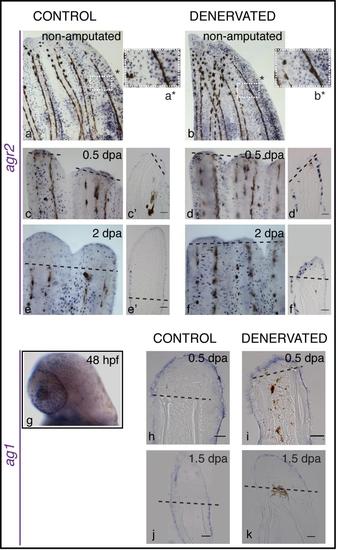
Expression of nAg homologues in zebrafish. a-f) Whole mount mRNA ISH of agr2. c′-f′) Longitudinal sections of the rays using whole mount ISH. Agr2 mRNA is expressed in the mucous secreting cells of the entire epidermis in both non-amputated (a,b) and amputated fins (c-f). During regeneration, agr2 is also expressed in the mucous secreting cells present in the newly formed WE. There are no obvious differences between control (a,c,e) and denervated fins (b,d,f) in the amount of agr2- positive cells, in both non-amputated fins and during regeneration. g-k) Whole mount mRNA ISH of ag1. g) Ag1 mRNA is expressed in the mucous secreting cells of the larvae body at 48 hours post fertilization (hpf). h-k) Longitudinal sections of the rays using whole mount ISH show wide expression of ag1 in the epidermis and WE of adult fins, as early as 0.5 dpa, and throughout regeneration. There are no differences in ag1 expression between control and denervated fins, in both non-amputated and amputated fins. |