
|
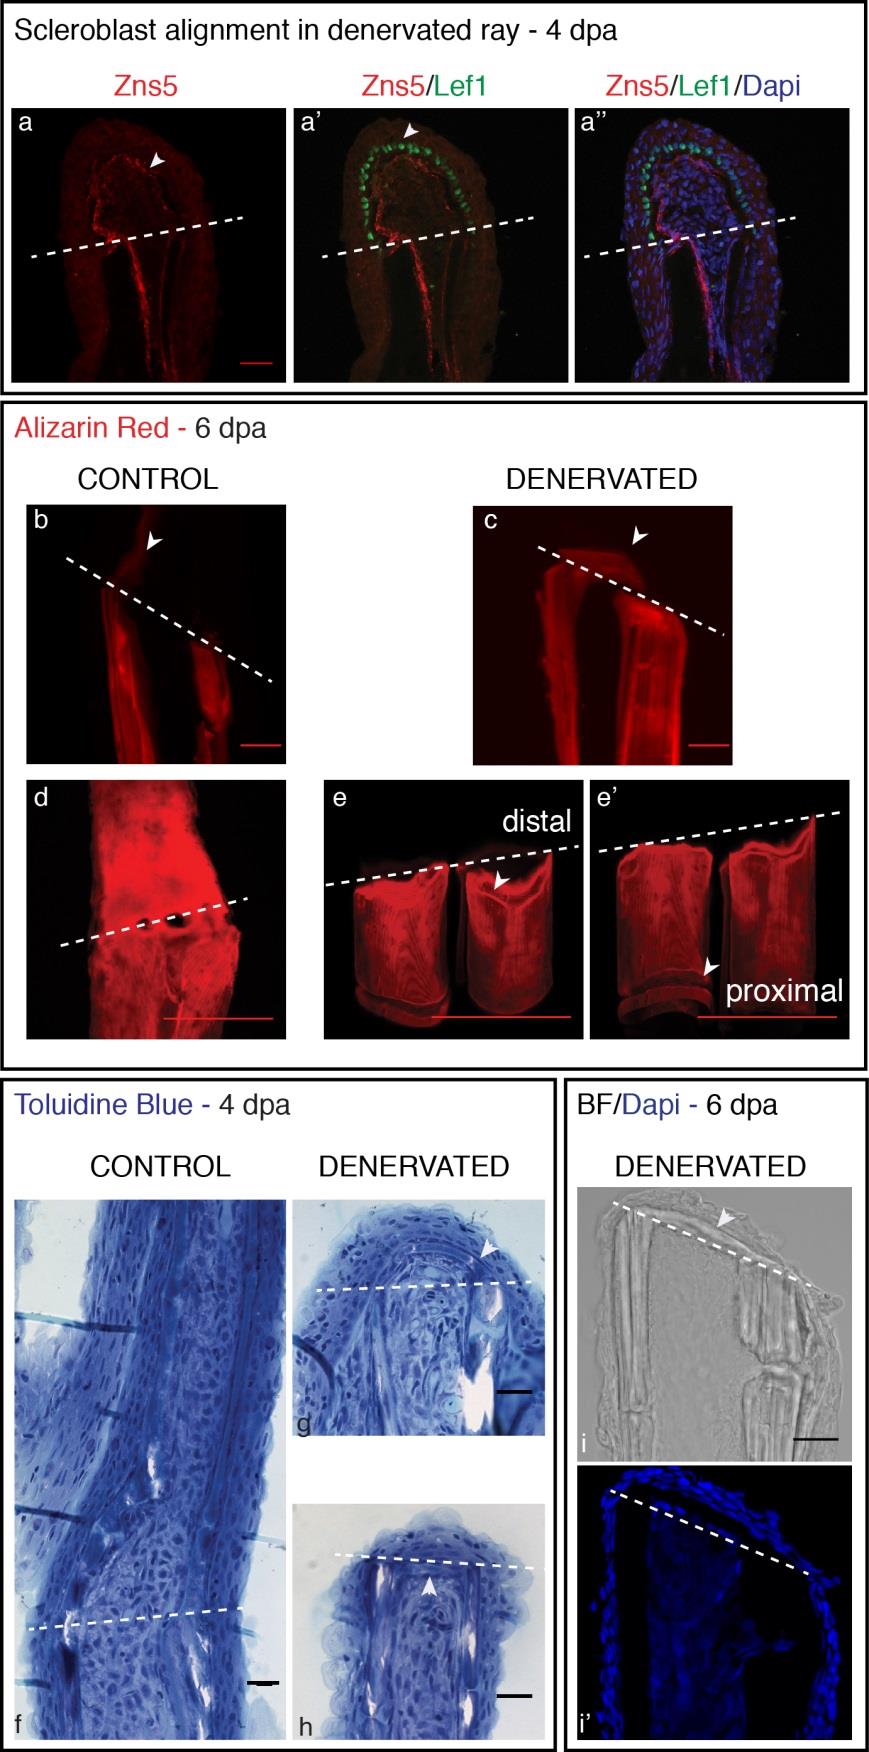
Fig. S4
Bone deposition in the amputation plane of denervated fins. a) Staining in longitudinal sections for Zns5, Lef1 and DAPI. Zns5-positive cells accumulate below the BEL of denervated fins, forming an arch that delimits mesenchymal cells. Lef1 is ectopically expressed in the whole BEL (a′). b,c) Staining with ARS in longitudinal sections. Alizarin Red staining at 6 dpa shows mineralization of the newly formed ray along the old bony ray in control fins (b-arrowhead), while in denervated fins it shows bone deposition in at the amputation level (c -arrowhead). d,e) Staining with ARS in whole mount fins. The deposition of bone cells in the amputation site causes a thickening in the distal stump of deneravated fins. A 3D projection of denervated rays shows that the distal region (e-arrowhead) is comparatively thicker in relation to the proximal region (e′-arrowhead). f-h) Toluidine Blue histology in longitudinal sections. At 4 dpa cell deposition between the 2 hemi-rays is observed in denervated fins (g,h). The new structure resembling bone matrix seems to be derived from the old bone (g - arrowhead) and a group of cells, resembling bone cells, are deposited at the level of amputation almost closing the ray (h - arrowhead). i) DAPI staining in longitudinal sections. At 6 dpa a bright field image shows matrix deposition at the level of amputation between the two hemi-rays (arrowhead). a-e, i) The images are a projection of confocal optical slices. Dashed lines mark amputation plane. a,e) Scale bar - 25 µm. b-d) Scale bar - 50 µm.