
|
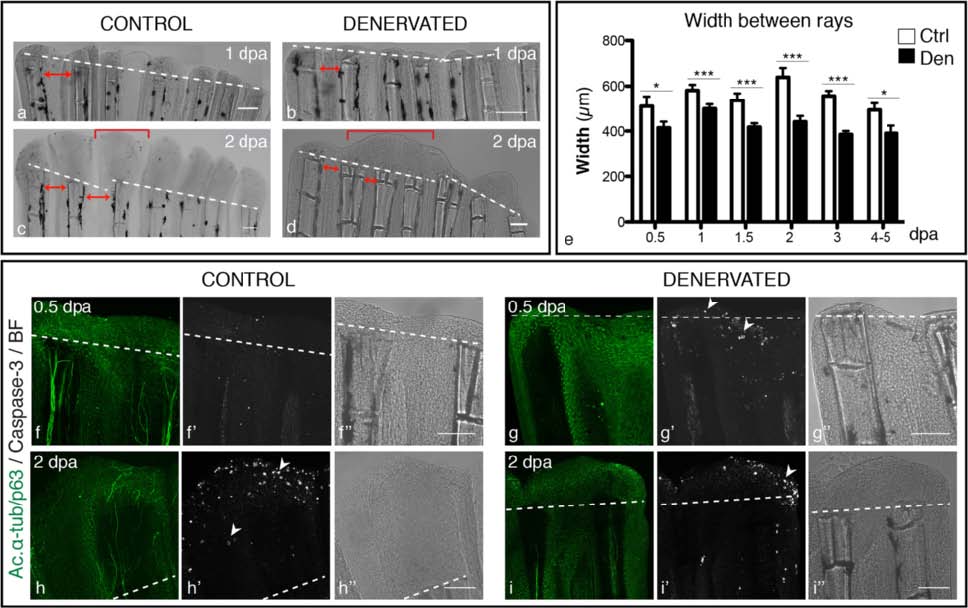
Fig. 3
Width of regenerated fins, upon denervation. a-d) Brightfield images show that the inter-ray region of denervated fins is reduced in relation to controls. Additionally, “merged blastemas” (bracket) are observed on consecutive rays at 2 dpa (d), in contrast to single-ray blastemas found in control fins (c). Solid red arrowed lines indicate the inter-ray width. e) Quantification of inter-ray width. Measurements of rays and inter-ray units show that width of denervated fins is significantly smaller than that of the controls (***p < 0.0001, *p < 0.05). f-i) Apoptosis in whole mount amputated fins. Staining for activated caspase3 and ac. α-tub/p63 in whole mount fins activity reveals an increase in apoptotic cells in the WE and in the inter-ray region (arrowhead) of denervated fins, during the first day after amputation (g′). At 2 dpa, activated caspase-3 is expressed in the epidermis of both control (h′) and denervated and fins (i′). a-d, f-i) The images are a projection of confocal optical slices. Dashed lines mark amputation plane. Scale bar - 100 µm.