
|
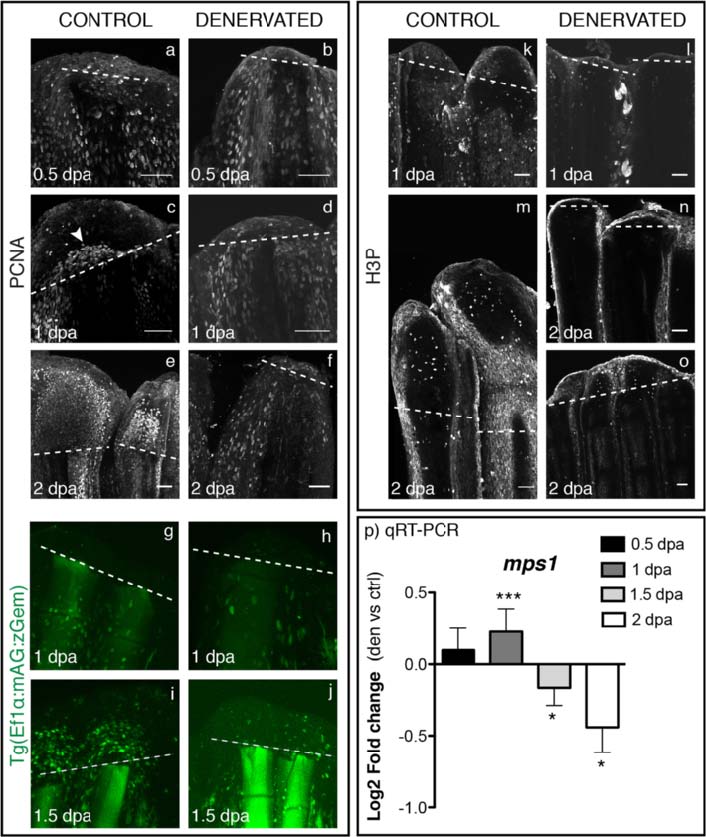
Fig. 4
Analysis of cell cycle markers in mesenchymal cells, upon denervation. a-f) Staining for PCNA in whole mount fins shows equal expression in epidermal and mesenchymal cells of both control and denervated fins at 0.5 dpa (a,b). At 1 dpa, PCNA-positive cells start to accumulate at the level of amputation in the region that will give rise to the blastema in control fins (c - arrowhead), which is not observed in denervated fins (d). At 2 dpa control fins show an accumulation of PCNA-positive cells in the blastema region (e), while denervated fins resemble as 0.5 dpa fins (f). g-j) Live imaging with the Tg(Ef1α:mAG:zGem). At 1 dpa Geminin-positive cells are equally expressed in control (g) and denervated fins (h). GFP nuclei started to be evident in the mesenchyme above the amputation plane of control fins at 1.5 dpa (i), but not in the denervated ones (j). k-o) Staining for H3P in whole mount fins. H3P starts to be expressed at 1 dpa in some mesenchymal cells of control fins (k). At 2 dpa H3P-positive cells are present only in control fins (m) and in reduced number in partially regenerating denervated fins (o). Note: H3P has a non-specific label in distal epidermal cells, as previously reported 42]. a-o) The images are a projection of confocal optical slices. Dashed lines mark amputation plane. Scale bar - 50 µm. p) qRT-PCR formps1. Mps1 levels of expression increase in denervated fins at 1 dpa and decrease at 1.5 and 2 dpa, in relation to controls (***p < 0.0001, *p < 0.05).