
- Title
-
A Digital Framework to Build, Visualize and Analyze a Gene Expression Atlas with Cellular Resolution in Zebrafish Early Embryogenesis
- Authors
- Castro-González, C., Luengo-Oroz, M.A., Duloquin, L., Savy, T., Rizzi, B., Desnoulez, S., Doursat, R., Kergosien, Y.L., Ledesma-Carbayo, M.J., Bourgine, P., Peyriéras, N., Santos, A.
- Source
- Full text @ PLoS Comput. Biol.
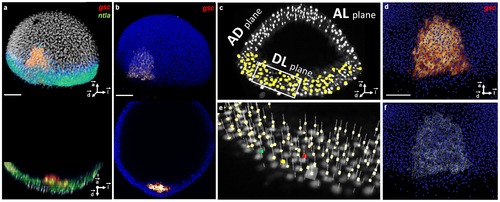
3D raw data, nuclear center detection, gene pattern segmentation and their validation at 6.3 hpf. (a) Upper panel: volume rendering, lower panel: axial orthoslice of an analyzed embryo′s nuclei (white), reference gsc pattern (red) and ntla pattern (green). (b) Same with template nuclei (blue) and their gsc pattern (red). (c) Nuclear positions (yellow) superimposed on the raw nucleus images (white) displayed by three orthoslices in the AL, AD and DL planes. (d) Zoom on the template gsc raw expression (red) superimposed on the template nuclear positions (blue). (e) 3× zoom on the boxed region in (c) with detected nuclei positions (pale yellow), an example of a validated nucleus (green), a false positive (red), a false negative (yellow) and a selected position to be evaluated (white cube). (f) Same as (d) with the segmented gsc domain (white). Scale bars, 100 μm. Axes point to the animal pole (⇀a), dorsal side (⇀d) and lateral side (⇀l) of the embryo respectively. |
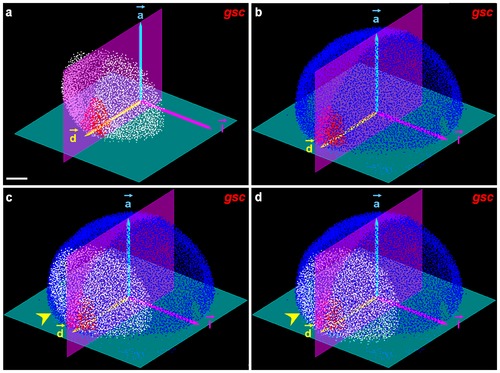
Mapping procedure in the 6.3 hpf atlas template. (a) Analyzed embryos: detected nuclei (white), gsc positive cells (red), automated initialization scheme extracting the plane passing through the blastoderm margin (green), bilateral symmetry plane (purple), and referential (⇀a,⇀d,⇀l). (b) Same with the template, detected nuclei in blue. (c) Initialization step aligning the (⇀a,⇀d,⇀l) basis of the analyzed embryo and the template; the yellow arrowhead points to a mismatch refined in (d) through the registration procedure. Scale bar 100 μm. |
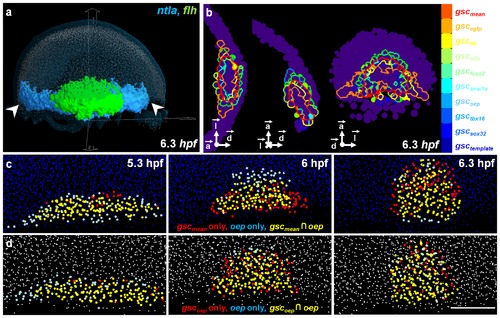
Exploring the 3D atlas with the visualization tool Atlas-IT. (a) Atlas-IT interface displaying the template nuclei (light blue), segmented gene expression patterns of ntla (blue) and flh (green). (b) From left to right: equatorial, sagittal and dorsal views of the 9 individual gsc boundaries as compared to the mean gsc domain (red) at 6.3 hpf. (c) Evolution of the oep-gsc(mean) pair over time after being mapped onto the template. (d) Evolution of the oep-gsc(oep) pair over time in the analyzed embryo where they were co-stained. Scale bar 100 μm. |
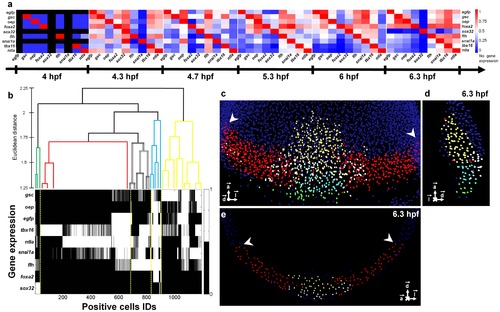
Assessing gene coexpression and cell genetic profiles. (a) Matrix displaying the percentage of cells coexpressing any given gene pair at developmental stages from 4 to 6.3 hpf (see also Fig. S21). Gene pairs were ordered according to the similarity of the evolution of their patterns over time (Fig. S23). (b) Spatial WPGMA clustering at 6.3 hpf of the 1,194 positive cells according to the similarity of their gene expression profiles. (c) Volume rendering, (d) lateral view and (e) coronal view of template nuclei at 6.3 hpf. Nuclei were classified according to their gene expression profiles, which revealed 5 distinct morphogenetic domains: dorsal hypoblast (yellow), marginal dorsal epiblast (blue), dorsal epiblast (white), paraxial and lateral blastoderm margin (red), forerunners and dorsal YSL (green). White arrowheads indicate the limits of the imaged analyzed embryos. Upper panel, sagittal section, lower panel equatorial section passing through the embryonic shield. Scale bar 100 μm. |