
Fig. 2
- ID
- ZDB-FIG-140828-3
- Publication
- Castro-González et al., 2014 - A Digital Framework to Build, Visualize and Analyze a Gene Expression Atlas with Cellular Resolution in Zebrafish Early Embryogenesis
- Other Figures
- All Figure Page
- Back to All Figure Page
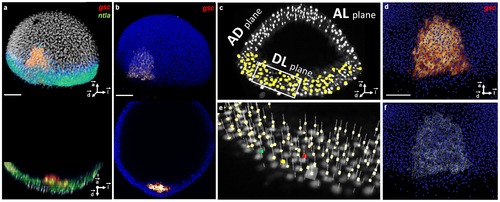
3D raw data, nuclear center detection, gene pattern segmentation and their validation at 6.3 hpf. (a) Upper panel: volume rendering, lower panel: axial orthoslice of an analyzed embryo′s nuclei (white), reference gsc pattern (red) and ntla pattern (green). (b) Same with template nuclei (blue) and their gsc pattern (red). (c) Nuclear positions (yellow) superimposed on the raw nucleus images (white) displayed by three orthoslices in the AL, AD and DL planes. (d) Zoom on the template gsc raw expression (red) superimposed on the template nuclear positions (blue). (e) 3× zoom on the boxed region in (c) with detected nuclei positions (pale yellow), an example of a validated nucleus (green), a false positive (red), a false negative (yellow) and a selected position to be evaluated (white cube). (f) Same as (d) with the segmented gsc domain (white). Scale bars, 100 μm. Axes point to the animal pole (⇀a), dorsal side (⇀d) and lateral side (⇀l) of the embryo respectively. |