
FIGURE
Fig. 3
- ID
- ZDB-FIG-140828-4
- Publication
- Castro-González et al., 2014 - A Digital Framework to Build, Visualize and Analyze a Gene Expression Atlas with Cellular Resolution in Zebrafish Early Embryogenesis
- Other Figures
- All Figure Page
- Back to All Figure Page
Fig. 3
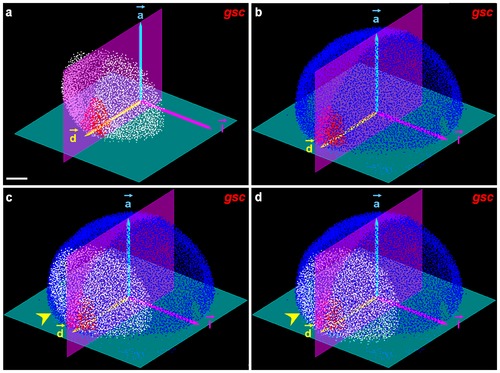
Mapping procedure in the 6.3 hpf atlas template. (a) Analyzed embryos: detected nuclei (white), gsc positive cells (red), automated initialization scheme extracting the plane passing through the blastoderm margin (green), bilateral symmetry plane (purple), and referential (⇀a,⇀d,⇀l). (b) Same with the template, detected nuclei in blue. (c) Initialization step aligning the (⇀a,⇀d,⇀l) basis of the analyzed embryo and the template; the yellow arrowhead points to a mismatch refined in (d) through the registration procedure. Scale bar 100 μm. |
Expression Data
Expression Detail
Antibody Labeling
Phenotype Data
Phenotype Detail
Acknowledgments
This image is the copyrighted work of the attributed author or publisher, and
ZFIN has permission only to display this image to its users.
Additional permissions should be obtained from the applicable author or publisher of the image.
Full text @ PLoS Comput. Biol.