
FIGURE
Fig. 4
- ID
- ZDB-FIG-140828-5
- Publication
- Castro-González et al., 2014 - A Digital Framework to Build, Visualize and Analyze a Gene Expression Atlas with Cellular Resolution in Zebrafish Early Embryogenesis
- Other Figures
- All Figure Page
- Back to All Figure Page
Fig. 4
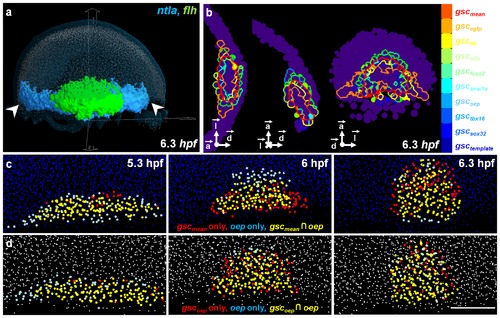
Exploring the 3D atlas with the visualization tool Atlas-IT. (a) Atlas-IT interface displaying the template nuclei (light blue), segmented gene expression patterns of ntla (blue) and flh (green). (b) From left to right: equatorial, sagittal and dorsal views of the 9 individual gsc boundaries as compared to the mean gsc domain (red) at 6.3 hpf. (c) Evolution of the oep-gsc(mean) pair over time after being mapped onto the template. (d) Evolution of the oep-gsc(oep) pair over time in the analyzed embryo where they were co-stained. Scale bar 100 μm. |
Expression Data
Expression Detail
Antibody Labeling
Phenotype Data
Phenotype Detail
Acknowledgments
This image is the copyrighted work of the attributed author or publisher, and
ZFIN has permission only to display this image to its users.
Additional permissions should be obtained from the applicable author or publisher of the image.
Full text @ PLoS Comput. Biol.