
|
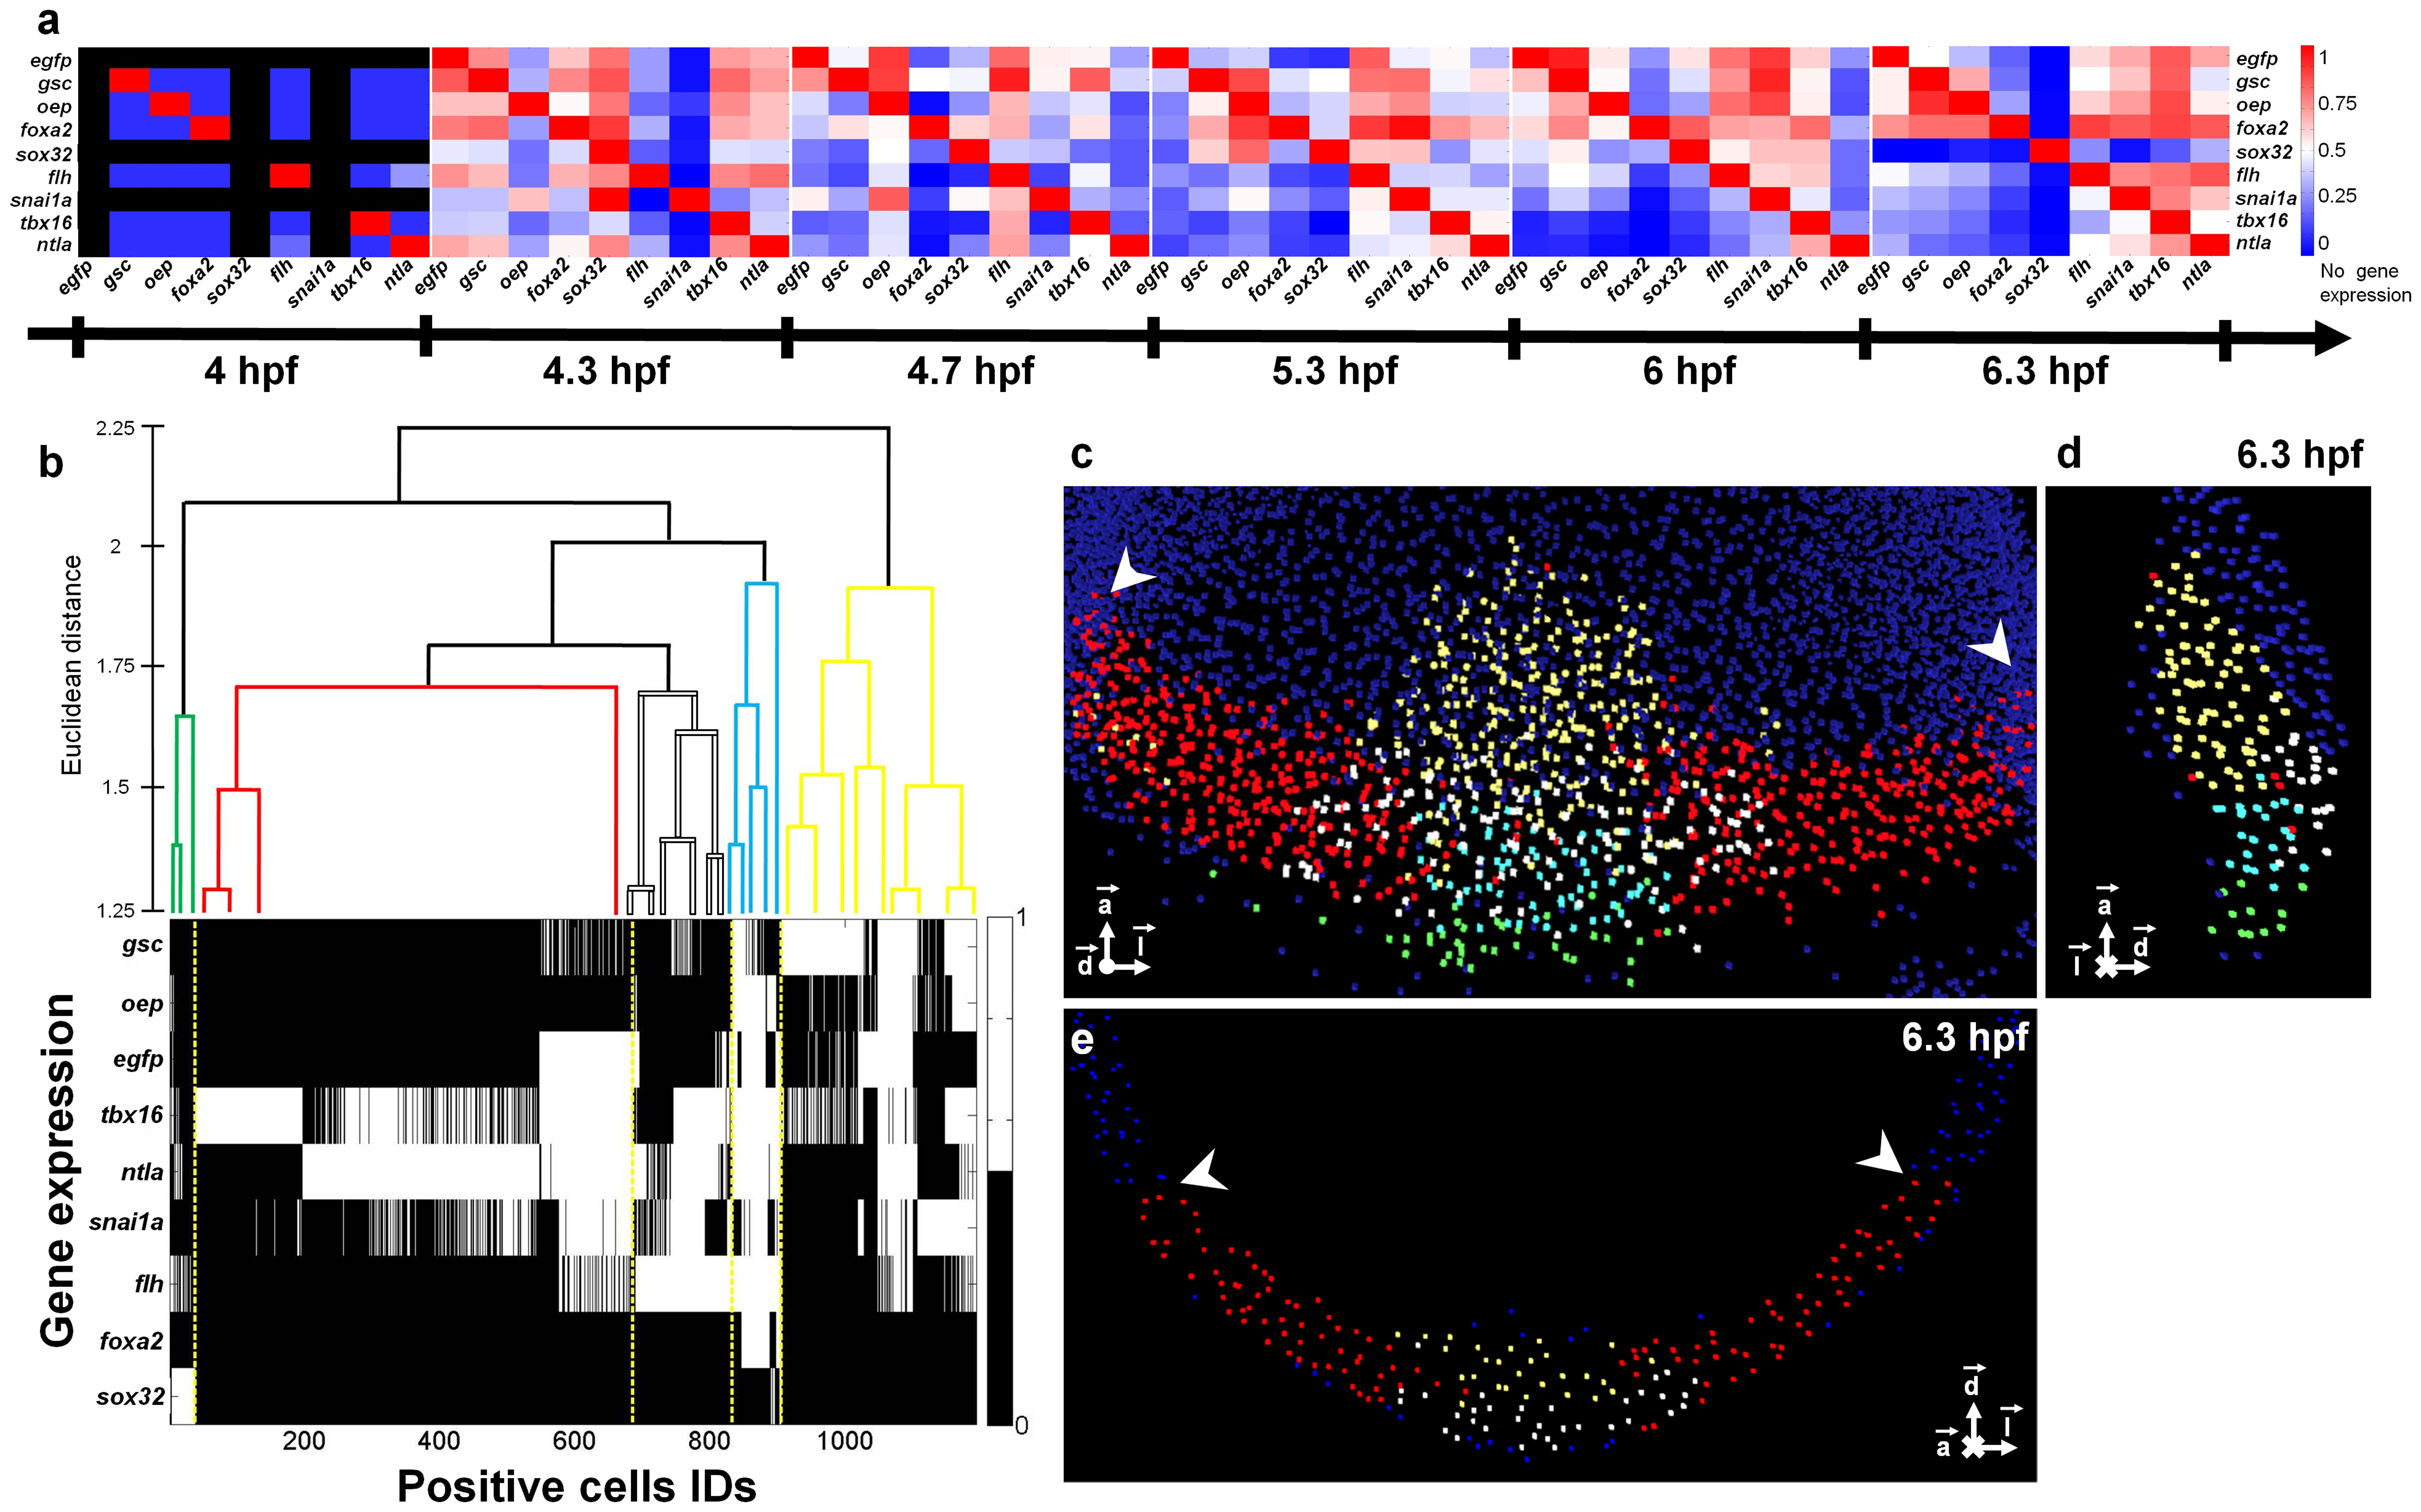
Fig. 5
Assessing gene coexpression and cell genetic profiles.
(a) Matrix displaying the percentage of cells coexpressing any given gene pair at developmental stages from 4 to 6.3 hpf (see also Fig. S21). Gene pairs were ordered according to the similarity of the evolution of their patterns over time (Fig. S23). (b) Spatial WPGMA clustering at 6.3 hpf of the 1,194 positive cells according to the similarity of their gene expression profiles. (c) Volume rendering, (d) lateral view and (e) coronal view of template nuclei at 6.3 hpf. Nuclei were classified according to their gene expression profiles, which revealed 5 distinct morphogenetic domains: dorsal hypoblast (yellow), marginal dorsal epiblast (blue), dorsal epiblast (white), paraxial and lateral blastoderm margin (red), forerunners and dorsal YSL (green). White arrowheads indicate the limits of the imaged analyzed embryos. Upper panel, sagittal section, lower panel equatorial section passing through the embryonic shield. Scale bar 100 μm.