
- Title
-
Oxidative stress and regulation of Pink1 in zebrafish (Danio rerio)
- Authors
- Priyadarshini, M., Orosco, L.A., and Panula, P.J.
- Source
- Full text @ PLoS One
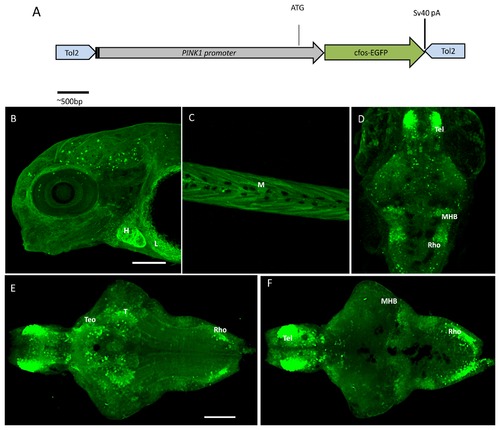
The PINK1 promoter construct and expression pattern in zebrafish larva of the Tg(pink1:EGFP) line. A. Construction of the PINK1 promoter DNA fragment A. Construction of the PINK1 promoter DNA fragment comprising the sequence -2 kb upstream of the 5′ end of the pink1 gene and including the ATG start site. This is inserted in the cloning site in the Tol2 transposon vector pCS-cfosGFP, which contains a small intronic sequence and a GFP expression cassette having minimal cfos activity [21]. B-F. Confocal z-stack images of the whole-mount Tg(pink1:EGFP) larval stages. B. GFP expression as observed in peripheral tissues at different stages of development by GFP IHC. In a lateral view of 4 dpf whole mount larvae, expression was observed in the heart (H) and liver (L); anterior to the left. C. Expression in the muscle of the 4-dpf larvae in a lateral view (M); anterior to the left. D. The whole mount GFP expression at 5 dpf; dorsal views, anterior to the top, showing pronounced immunoreactive cells in brain regions such as the telencephalon (Tel), mid-hindbrain boundary (MHB) and rhombencephalon (rho). E- F. Dorsal and ventral views of the brain of 7-dpf Tg(pink1:EGFP) fish; anterior to the right. E. In the ventral view, the strongest GFP expression is seen in the telencephalon (Tel), anterior part of optic tectum (TeO), thalamus (T), and the lateral rhombencephalon (rho). F. The dorsal view shows the prominent expression in the mid-hindbrain boundary (MHB) along with Tel and rho. Scale bar represents 100μm. GFP – Green fluorescent protein, PINK1 – PTEN-induced putative kinase 1. |
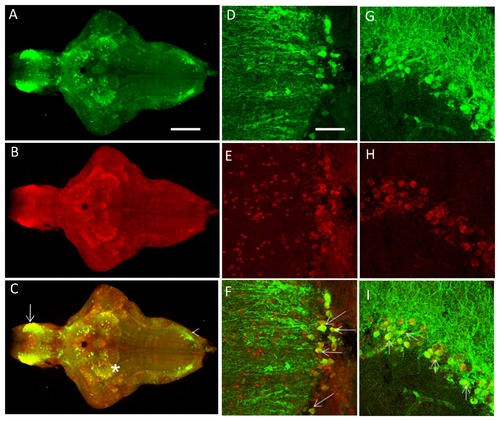
A-C. The PINK1-ir colocalizes with the GFP expression pattern in the brain of 7-dpf fish from the transgenic line in most parts of the brain. Colocalization was visualized in the telencephalon (arrow), the thalamic region (*), and the rhombencephalon (arrowhead). D-L. Representative higher magnification images from adult brain sections (25 μm) for PINK1-ir and GFP-ir. D-F represents the telencephalic region in the saggital plane. G-I represents the thalamic region, and J-L represents the rhombencephalic region from the coronal plane. GFP – Green fluorescent protein, PINK1 – PTEN-induced putative kinase 1, ir – Immunoreactivity. EXPRESSION / LABELING:
|
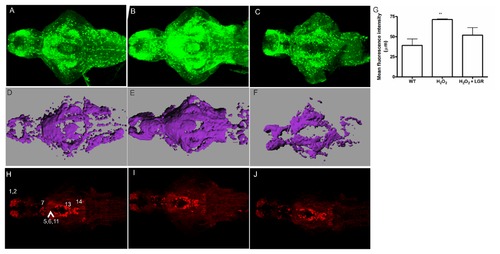
The effect of H2O2 on GFP and TH1 expression in Tg(pink1:EGFP) larval fish. A-C. GFP-ir at 7 dpf in the zebrafish larvae. GFP-ir increases in the H2O2-treated fish (B) as compared to the control fish (A). The effect is rescued in the LGR treated fish (C). D. Mean fluorescence intensity values of the WT, H2O2-treated group and the H2O2+LGR treated group. A significant change in the H2O2-treated group was observed (p < 0.01). E-G. A three-dimensional image to perform volume rendering was constructed using the Imaris MeasurementPro module in Imaris software for the above-mentioned fish at a similar threshold intensity. The changes indicated as the changed total volume of the representative images for control (E), H2O2 (F) and LGR-treated fish (G). Scale bar represents 80 μm. H-J. TH-ir is unchanged among the control (H), H2O2-treated (I) and H2O2 together with LGR (J) groups of larval fish. No change in the pretectal (7) and preoptic, thalamic or pre-tectal nucleus (5,6,11) cell populations was seen. Other visible groups in the olfactory bulb and ventral telencephalic nuclei (1,2), periventricular hypothalamus and posterior tuberculum (13), and the locus coeruleus (14) also displayed no change in TH-ir. Scale bar represents 100 μm. A-C and H-J. H2O2 – Hydrogen Peroxide, GFP – Green fluorescent protein, ir – immunoreactivity, LGR – L-glutathione reduced, PINK1 – PTEN-induced putative kinase 1, TH – tyrosine hydroxylase. EXPRESSION / LABELING:
|
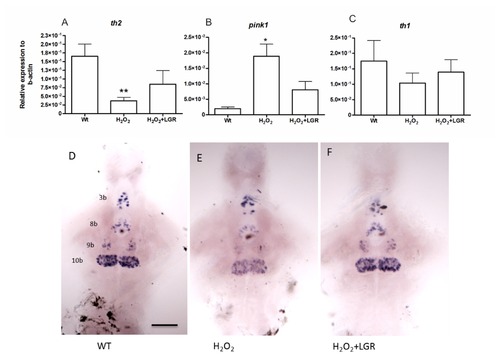
In-situ hybridization and q-RT-PCR at 3dpf in wild type fish following treatment with H2O2 and H2O2+LGR. A. The th2 transcript levels significantly decreased in the H2O2 treated samples, verified by q-RT-PCR. B. The pink1 transcript levels increased significantly in the H2O2 treated as compared to wild type samples. C. No significant change in the th1 transcript levels was detected between the groups. Only a declining trend was observed. Unpaired t-test (* p-value < 0.05, ** p-value< 0.01). D-F. The expression of th2 mRNA is reduced in group 10b of the 7-dpf H2O2-treated fish as compared with untreated control fish. In the LGR-treated groups at 8 dpf, the decrease in th2 mRNA expression was prevented. The th2-expressing neuron groups 3b, 8b, 9b, 10b are identified according to [26]. Scale bar represents 100 μM. th1 – tyrosine hydroxylase1, th2 – tyrosine hydroxylase 2, pink1 – PTEN-induced putative kinase 1. EXPRESSION / LABELING:
|
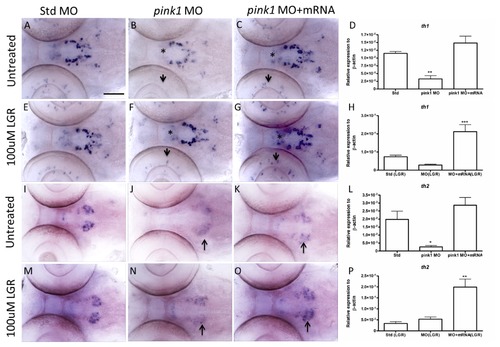
Expression levels of th1 and th2 mRNA at 3 dpf in pink1 morphants untreated and treated with LGR. A-C. Altered th1 expression in the untreated std ctrl MO, pink1MO, and pink1MO+mRNA groups. A decrease in th1 expression in the population 5,6,11 (*) in morphants (B) was observed as compared to the ctrl MO group (A). The expression could be rescued by pink1 mRNA co-injection (C). D. Representative quantitative graph for the untreated group. E-G. The expression of th1 ISH in LGR-treated groups. The drug LGR rescued the reduced th1 cells in the eyes and also group 5,6,11 of the morphants (E) as compared to the ctrl MO group (D). The expression is enhanced in the rescue group with the combined effect of LGR and pink1 mRNA (F). H. Graphical representation of the transcript levels for th1 in the LGR-treated group. A significant change in the pink1 mRNA co-injected group. I-K. The expression of th2 ISH in the untreated std MO, pink1MO, and pink1MO+mRNA groups. A loss of th2 was observed in group 10b in the pink1 morphants (H) as compared to ctrl MO (G). The pink1 mRNA rescued th2 expression in group 10b (I). L. The representative th2 transcript levels determined by q-RT-PCR for the untreated group. M-O. The expression of th2 ISH in LGR treated groups. LGR-treated pink1 MO shows a slight increase in the th2 10b group (K) as compared to ctrl MO (J). The pink1 mRNA along with LGR completely rescues the loss of th2 in the 10b cell group (L). P. Representative q-RT-PCR results for the th2 LGR-treated group. A significant change in the pink1 mRNA co-injected group together with LGR significantly increased the th2 transcript levels. Figures D and L present confirmation of th1 and th2 transcripts downregulation in the pink1 morphants. Figures H and P present the additive rescue effect of LGR together with pink1 mRNA on the morphants. The Bonferroni Hochberg multiple comparison statistical test was applied for the q-RT-PCR results (* p < 0.05, ** p < 0.01, *** p < 0.001). ISH – in-situ hybridization, LGR – L-glutathione reduced, MO – morpholino oligonucleotides, pink1 – PTEN-induced putative kinase 1, q-RT-PCR – quantitative real-time PCR, th1 – tyrosine hydroxylase1, th2 – tyrosine hydroxylase 2. Scale bar represents 100 μm. EXPRESSION / LABELING:
|
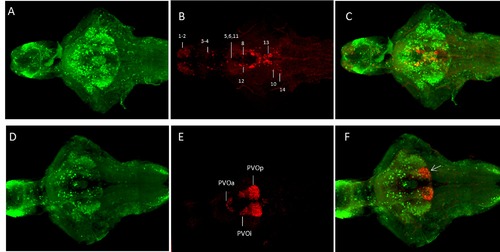
Comparison of the GFP expression pattern with TH-ir and 5-HT-ir in Tg(pink1:EGFP) fish at 7 dpf. D-F. TH ir compared to GFP distribution in the Tg(pink1:EGFP) fish. GFP is more widely distributed than TH-ir. A ventral view of the maximum projection images for TH and GFP. The cell populations and numbering are as in [28]. G-I. The 5-HT-ir is colocalized with GFP expression in the posterior recess of the paraventricular organ (arrowhead). 5-HT – 5-hydroxy tryptophan, TH – tyrosine hydroxylase, ir – immunoreactivity, GFP – Green fluorescent protein, PVOa – paraventricular organ anterior part, PVOi – paraventricular organ intermediate part, PVOp – paraventricular organ posterior part. Scale bar represents 100 μm. |
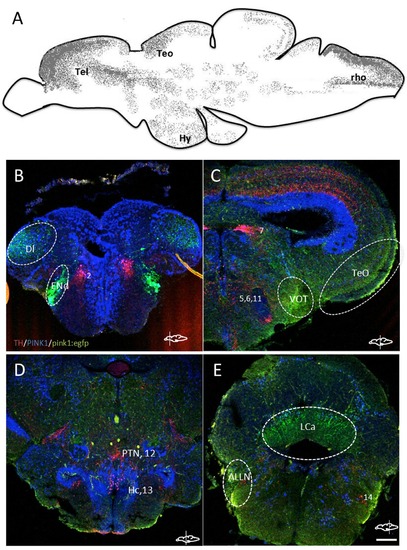
A. Schematic lateral view of pink1:egfp expressing regions in the zebrafish brain compiled from immunohistochemistry of larval and adult brain sections. The regions are marked as: Tel – telencephalon, Teo – anterior region of the optic tectum, Hy – hypothalamus, rho – rhombencephalon. B-E. Cryosections of different regions of the adult zebrafish brain with immunoreactivity detected for TH (red), PINK1 (blue) and pink1:egfp (green). The cell populations of TH-ir are reported with numbers, and additional regions of GFP are marked with dotted lines. Di – lateral zone of the dorsal telencephalon, ENd – endopeduncular nucleus, VOT – ventrolateral optic tract, TeO – tectum opticum, PTN – posterior tuberal nucleus, Hc – caudal zone of the periventricular hypothalamus, LCa – lobus caudalis cerebelli, ALLN – anterior lateral line nerves. Scale bar represents 100 μm. |
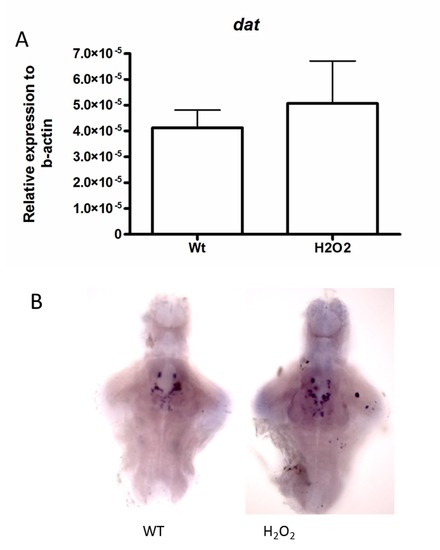
The transcript levels of dat in WT and H2O2-treated fish. A. Larval groups measured by q-RT-PCR. No significant level of transcript alteration was visualized amongst the groups. B. No change in expression levels between the two groups was also observed by ISH. Scale bar represents 100 μm. |