
Image
|
Figure Caption
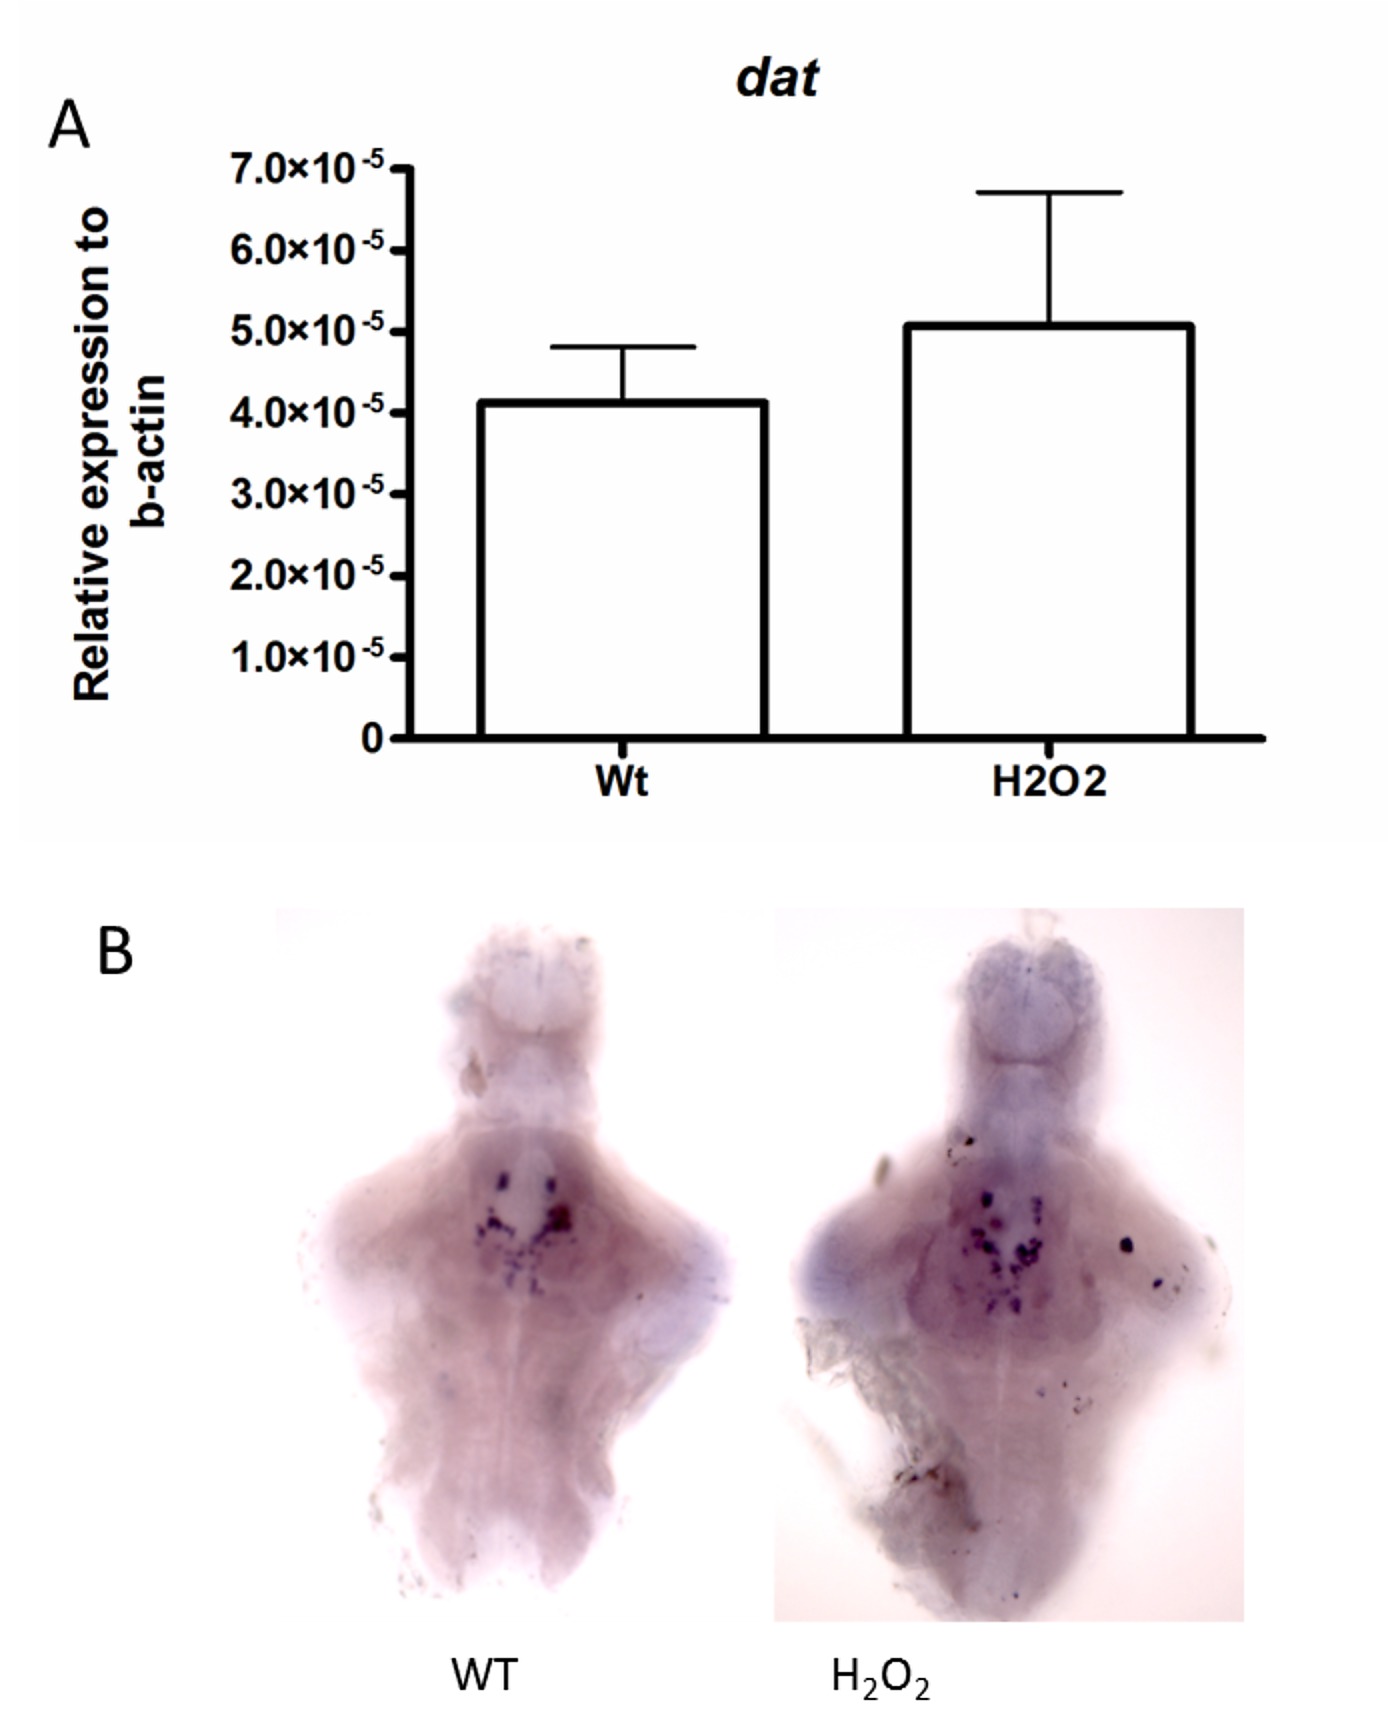
Fig. S3
The transcript levels of dat in WT and H2O2-treated fish. A. Larval groups measured by q-RT-PCR. No significant level of transcript alteration was visualized amongst the groups.
B. No change in expression levels between the two groups was also observed by ISH.
Scale bar represents 100 μm.
Acknowledgments
This image is the copyrighted work of the attributed author or publisher, and
ZFIN has permission only to display this image to its users.
Additional permissions should be obtained from the applicable author or publisher of the image.
Full text @ PLoS One