
- Title
-
Microcephaly models in the developing zebrafish retinal neuroepithelium point to an underlying defect in metaphase progression
- Authors
- Novorol, C., Burkhardt, J., Wood, K.J., Iqbal, A., Roque, C., Coutts, N., Almeida, A.D., He, J., Wilkinson, C.J., and Harris, W.A.
- Source
- Full text @ Open Biol.
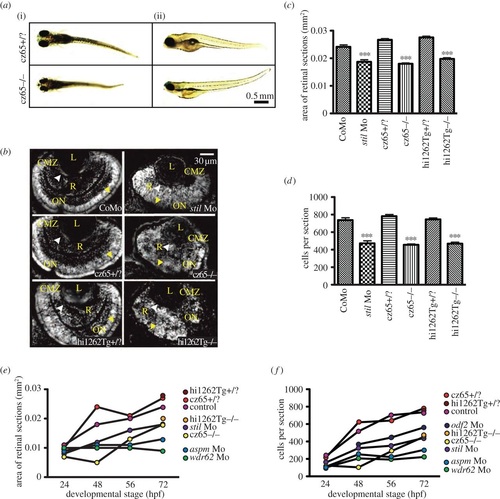
MCPH phenotypes in the zebrafish retina. Knockdown of MCPH genes causes a reduction in head size, retinal size and retinal cell number. (a) Reduction in head and eye size is demonstrated in whole-mount stilcz65-/- mutant embryos on day 5 of development. Healthy stilcz65+/? embryos are shown at the same developmental stage for comparison. While head and eye size were consistently reduced, overall body size/length of mutant embryos was variably affected. Here, one mutant (i) is smaller than the healthy embryo, whereas the other (ii) is similar in length and size to the healthy embryos. Note also the abnormally protruding lenses in the mutant embryo seen from (i), exposed owing to reduced retinal size. (b) DAPI-stained sections demonstrate reduced retinal area in stil morphants (stil Mo) at 72 hpf when compared with control morphants (CoMo). Similarly, the retinas of stilcz65-/- and stilhi1262Tg-/- mutant embryos at 72 hpf are markedly reduced in size. Labels in yellow: L, lens; R, retinal neuroepithelium; CMZ, ciliary marginal zone; ON, optic nerve; AM, apical membrane. (c) Retinal area is significantly reduced in stil morphant and mutant embryos: stil Mo 0.019 mm2 (n = 23) versus CoMo 0.024 mm2 (n = 34), p < 0.001; stilcz65-/- 0.019 mm2 (n = 23) versus stilcz65+/? 0.027 mm2 (n = 72) p < 0.001; stilhi1262Tg-/- 0.020 mm2 (n = 52) versus stilhi1262+/? 0.028 (n = 48), p < 0.001 (values are for mean area at 72 hpf). (d) Retinal cell number is reduced in stil morphants and mutants: stil Mo 471 cells (n = 23) versus CoMo 735 cells (n = 7), p < 0.001; stilcz65-/- 454 cells (n = 114) versus stilcz65+/? 780 cells (n = 72), p < 0.001; stilhi1262Tg-/- 468 cells (n = 52) versus stilhi1262+/? 744 cells (n = 48), p < 0.001 (values are for mean number of cells in central retinal sections at 72 hpf). (e) Retinal area increases as development progresses in stil, aspm, wdr62 and odf2 morphant embryos but remains reduced compared with control at all time-points examined (24, 48, 56 hpf at 72 hpf). (f) Retinal cell increases as development progresses in stil, aspm, wdr62 and odf2 morphant embryos but remains reduced compared with control at all time-points examined (24, 48, 56 hpf at 72 hpf), n = number of eyes analysed. PHENOTYPE:
|
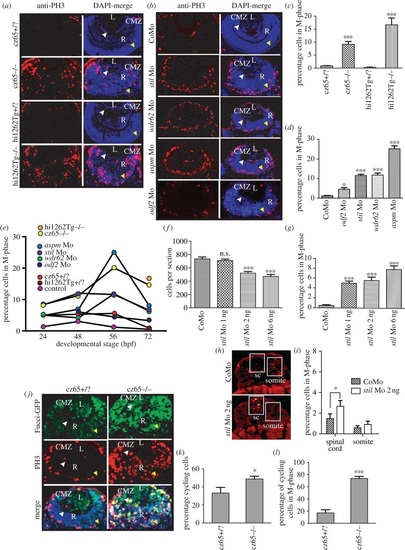
Knockdown of stil, aspm, wdr62 or odf2 results in an increase in mitotic cells within the developing zebrafish retina. (a) PH3 staining (red) reveals a dramatic increase in mitotic cells within the retina of stilcz65-/- versus stilcz65+/? embryos at 72 hpf and in stilhi1262Tg-/- versus stilhi1262+/? embryos. Mitotic cells were also abnormally localized in mutant embryos, being scattered throughout the retina rather than limited to the CMZ. DAPI-counterstain (blue) demonstrates the smaller retinas in mutant embryos, with a disorganized appearance and delayed lamination. (b) PH3 staining (red) demonstrates increased mitotic cells within stil, wdr62, aspm and odf2 morphant retinas at 56 hpf. Note that mitotic cells are localized to the apical membrane in morphant retinas, rather than scattered throughout the retina, although they are not restricted to the CMZ as in control embryos. DAPI-counterstain (blue) also demonstrates reduced retinal size and delayed lamination. (c) The percentage of retinal cells in mitosis (mitotic index; MI) was significantly increased in stilcz65-/- versus stilcz65+/? retinas: 14.6% (n = 71) versus 0.9% (n = 56), p < 0.001. A similar increase was observed in stilhi1262Tg-/- versus stilhi1262+/? retinas: 16.7% (n = 32) versus 0.3% (n = 29), p < 0.001 (values are for MI at 72 hpf). (d) A significant increase in MI was also seen in morphant embryos (values reflect MI at 56 hpf): odf2 Mo (4.5%; n = 14) versus control Mo (1.2%; n = 61), p < 0.05; stil Mo (11.6%; n = 12), p < 0.001; wdr62 Mo (11.8%; n = 13), p < 0.001); and aspm Mo (25.2%; n = 25), p < 0.001. (e) An increase in the MI was observed at all examined time-points for all mutant and morphant conditions. Here, MI is plotted against developmental time-points (24, 48, 56 and 72 hpf) for each condition. Note the peak of MI around 56 hpf in most mutant and morphant conditions and the slightly earlier peak at 48 hpf in control embryos. (f) Reduced amounts of stil Mo led to a similar but less severe reduction in the number of cells per retinal section: stil Mo 6 ng (471 cells, n = 23), versus 735 p < 0.001; stil Mo 2 ng (521 cells, n = 17), versus 735 p < 0.001); stil Mo 1 ng (710 cells; n = 13) versus 735 cells in control embryos (n = 7), p > 0.05). (g) Reduced amounts of stil Mo also led to a corresponding reduction in the MI: stil Mo 6 ng 7.7% (n = 12), versus 0.5% p < 0.001; stil Mo 2 ng 5.5% (n = 17), versus 0.5% p < 0.001); stil Mo 1 ng 5.0% (n = 13) versus 0.5% in control embryos (n = 15), p < 0.001). (h) PH3 staining (yellow arrowheads) of spinal cord (sc) and somite tissue in control embryos and embryos injected with 2 ng anti-stil morpholino. (i) Comparison of the percentage of cells in M-phase in spinal cord and somites (n = 21 anti-stil morpholino versus n = 24 control morpholino embryos). (j) Fucci-GFP expression (green) in cycling cells, combined with anti-PH3 immunostaining (red) of fixed sections and DAPI-counterstain (blue) demonstrates an increase in the percentage of cells in stilcz65-/- retinas that are in the cell cycle at 32 hpf and a marked increase in the percentage of those cycling cells that are in mitosis. Note also the distribution of cycling cells is abnormal, with most cycling cells (green) localized in the CMZ in control embryos but throughout the retina in mutants. Furthermore, mitotic cells (red) are seen only at the apical membrane in control retinas but throughout the retina in mutants. (k) The percentage of retinal cells in the cell cycle (excluding G1) is increased in stilcz65-/- (49%; n = 14) versus stilcz65+/? embryos (33%; n = 5), p < 0.01). (l) The percentage of these cycling cells in mitosis was also dramatically increased in stilcz65-/- (74%; n = 14) versus stilcz65+/? embryos (17%; n = 5, p < 0.001). n = number of eyes analysed. Labels: L, lens; R, retina; CMZ, ciliary marginal zone; white arrowhead, basal membrane; yellow arrowhead, apical membrane. PHENOTYPE:
|
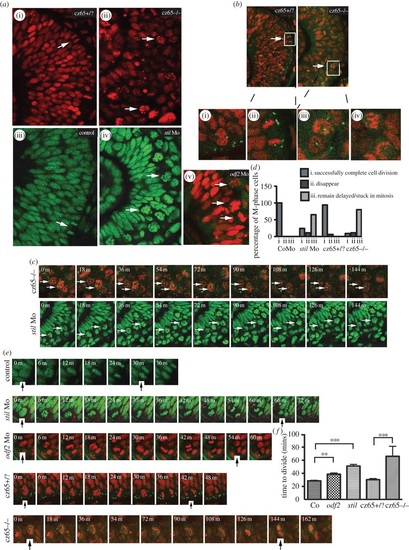
MCPH gene depletion causes a block or delay at prometaphase. Mitotic retinal cells in stil mutant embryos appear to be delayed in prometaphase. A similar but less severe phenotype occurs in stil morphants and odf2 morphants. (a) Views of the retina at approximately 30 hpf demonstrate (i) the normal appearance of retinal progenitor cells in stilcz65+/? embryos (H2B-RFP marks nuclei red) and (iii) control embryos (H2B-GFP marks nuclei green). White arrows mark dividing cells (anaphase) at the apical membrane. (ii) By contrast, in stilcz65-/- embryos the retina appears disorganized with markedly more cells in mitosis. The appearance of these cells (white arrows) suggests they are in prometaphase. A similar but less severe phenotype was observed in (iv) stil morphants and (v) odf2 morphants. In both morphant conditions, numerous ‘prometaphase’-like cells were observed in the retina (white arrows), although in contrast to mutants these cells were localized near to the apical membrane. (b) Centrosomal abnormalities are present in stilcz65-/- embryo retinas, including reduced centrosome expression and loss of apical centrosome positioning. Normal apical centrosomes are seen in stilcz65+/? embryos (green; centrin-GFP). (i) As cells round up and enter mitosis in stilcz65+/? embryos two centrosomes can be seen. (ii) A dividing cell is shown in a stilcz65+/? embryo, with a single centrosome at each pole of the newly forming daughter cells. By contrast, in stilcz65-/- embryos mitotic cells lack one or both centrosomes. (iii) Many prometaphase-like cells appear to be associated with only a single centrosome (white arrows, and at high magnification in (v) or (iv) no centrosome. (c) Many mitotic cells in stilcz65-/- mutants and stil morphants remain arrested in mitosis throughout live 2-3 h movies. Here frames demonstrate cells arrested in mitosis (white arrows) in stilcz65-/- embryos (nuclei in red; marked by H2B-RFP; centrosomes in green; marked by centrin-GFP) over a period of at least 144 min. Over the same period, stil morphant cells (green; marked by H2B-GFP) are also seen arrested in mitosis (white arrows). (d) Throughout movies a marked reduction in the percentage of cells successfully completing division was noted in stil mutants and morphants, with many cells remaining delayed or stuck in mitosis. In control embryos, 100% of cells entering mitosis during the first 2 h of a 3-h movie successfully completed cell division before the end of the 3-h movie (n = 29). A similar outcome was observed in stilcz65+/? control embryos; 94% of cells successfully completed cell division with 6% of cells disappearing from view (n = 17). In stil morphants, only 24% of cells successfully completed division, with 11% disappearing from view and 65% remaining arrested or delayed in M-phase for 60 min or longer (n = 37). In stilcz65-/- mutants, the phenotype was even more severe, with 11% of mitotic cells disappearing, 80% remaining stuck or delayed in M-phase and only 9% successfully completing mitotic division (n = 54). Three separate 180-min movies were analysed for each condition. n = total number of mitotic cells analysed for each condition. (e) Successful mitotic divisions were slower in morphants and mutants versus control. Typical divisions are shown for control, stil morphant, odf2 morphant, stilcz65+/? and stilcz65-/- embryos. Black vertical arrows indicate the beginning of M-phase (0 min), when the dividing cell rounds up at prophase, and the end of M-phase, when two daughter cells have been formed and chromatin decondensation has commenced. In these examples, mitosis took approximately 30 min (control), 66 min (stil Mo), 54 min (odf2 Mo), 42 min (stilcz65+/?) and a minimum of 144 min (stilcz65-/-) (note that for the stilcz65-/- mutant the dividing cell had already entered M-phase before the movie commenced so the true length of time to complete division was longer than this minimum estimate). (f) The time for morphant and mutant retinal cells to successfully complete mitotic division was increased. Three separate movies were analysed for each condition. The mean time to complete mitotic cell division was increased in stil morphants (n = 23) versus control (n = 29) (51 versus 29 min; p < 0.001) and odf2 morphants (n = 55) (38.7 versus 29 min; p < 0.01). The mean time to complete mitotic cell division was also markedly increased in stilcz65-/- embryos (n = 5) versus stilcz65+/? (n = 15) (at least 66 versus 30 min; p < 0.001). Overall, mitotic cell division within the retina was most severely prolonged in stilcz65-/- mutants and moderately prolonged in both stil morphants and odf2 morphants. n = number of successful mitotic divisions analysed. |
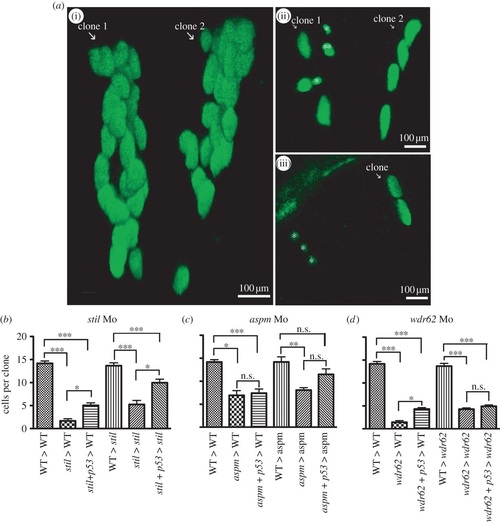
Morpholino knockdown of stil, aspm or wdr62 led to reduced clonal proliferation of retinal progenitors in vivo. Blocking apoptosis only partially rescued clonal potential. Cells from H2B-GFP-expressing wild-type (WT) or morphant donor embryos were transplanted into WT or morphant host embryos at approximately 3.5 hpf. Host embryo retinas were screened for GFP-expressing one to two cell clones at 24 hpf and those clones were analysed again at 48 hpf. Graphs (b-d) show the mean cells per clone at 48 hpf (derived from a single cell at 24 hpf). The average size of retinal clones derived from WT cells in WT hosts was 14.2 cells (n = 73). (a)(i) Two typical WT clones in a WT host retina at 48 hpf, each derived from a two-cell clone identified at 24 hpf. No significant difference in clone size was seen when cells from control embryos were transplanted into WT environments (not shown): CoMo: 13.9 cells (n = 7) versus WT: 14.2 cells (n = 73) (p > 0.05). (b) stil morphant cells had a markedly reduced clonal capacity in WT hosts: stil Mo 1.7 cells (n = 8) versus 14.2 cells for WT (n = 73) (p < 0.001). Partial rescue of clone size was achieved with injection of anti-p53 Mo to block apoptotic cell death: stil + p53 Mo donor cells in WT hosts: 5.1 cells (n = 25) versus 1.7 cells without p53 Mo (n = 8) (p > 0.05). However, clones remained significantly smaller than WT: 5.1 cells (n = 25) versus 14.2 cells (n = 73) (p < 0.001). A similar result was seen when WT or stil morphant cells were transplanted into stil morphant hosts. Within the morphant environment, stil morphant cells produced smaller retinal clones compared with WT cells: 5.2 cells (n = 9) versus 13.7 cells (n = 27) (p < 0.001). (a)(ii) A typical example of morphant cell clones within a morphant host environment at 48 hpf. GFP-expressing cells from a stil morphant donor were transplanted into a stil morphant host. Clone 1 contains seven cells with one cell (marked double asterisks (**)) presumed to be undergoing mitosis at the time of imaging. In addition, two small cells that appear to be shrinking (marked single asterisk (*)) were presumed to be undergoing apoptotic cell death. Clone 2 contains four cells. Partial rescue of clone size could be achieved by injection of anti-p53 Mo to block apoptotic cell death: stil + p53 Mo donor cells in stil hosts: 10.0 cells (n = 31) versus 5.2 cells (n = 9) (p < 0.05). However, clones remained significantly smaller than WT clones: 10.0 cells (n = 31) versus 13.7 cells (n = 27) (p < 0.001). (c) aspm morphant cells also produced smaller clones than WT cells; 6.9 cells (n = 3) versus 14.2 cells (n = 73) (p < 0.05). Partial rescue of clone size could be achieved by injection of anti-p53 Mo: aspm + p53 Mo donor cells in WT hosts: 7.4 cells (n = 20) versus 6.9 cells without p53 Mo (n = 3) (p > 0.05). However, clones remained significantly smaller than WT: 7.4 cells (n = 20) versus 14.2 cells (n = 73) (p < 0.01). Within the morphant environment, aspm morphant cells produced smaller retinal clones than WT cells: 8.1 cells (n = 15) versus 14.2 cells (n = 12) (p < 0.01). Partial rescue of clone size could be achieved with injection of anti-p53 Mo: aspm + p53 Mo donor cells in aspm hosts: 11.5 cells (n = 14) versus 8.1 cells (n = 15); p < 0.05. However, clone size still remained smaller than WT clones: 11.5 cells (n = 14) versus 14.2 cells (n = 12) (p > 0.05). (d) wdr62 morphant cells also produced smaller clones than WT; 1.5 cells (n = 12) versus 14.2 cells (n = 73) (p < 0.001). (a)(iii) A typical example of morphant cell clones within a WT host environment at 48 hpf. GFP-expressing wdr62 morphant cells were transplanted into WT host embryos. Two clones are seen, derived from two single cells identified at 24 hpf. One clone (white arrow) contains two cells. The second clone consists of three small cells (marked single asterisk (*)), all presumed to be undergoing apoptotic cell death. Partial rescue of clone size was achieved by injection of anti-p53 Mo: wdr62 + p53 Mo donor cells in WT hosts: 4.3 cells (n = 40) versus 1.4 cells without p53 Mo (n = 12) (p < 0.05). However, clones remained significantly smaller than WT clones: 4.3 cells (n = 40) versus 14.2 cells (n = 73) (p < 0.001). Within the morphant environment, wdr62 morphant cells produced smaller clones than WT cells: 4.3 cells (n = 26) versus 13.7 cells (n = 18) (p < 0.001). No significant rescue was achieved by injection of anti-p53 Mo to block apoptotic cell death: wdr62 + p53 Mo donor cells in wdr62 hosts: 4.9 cells (n = 28) versus 4.3 cells (n = 26) (p > 0.05). Clone size remained significantly smaller than WT clones: 4.9 cells (n = 28) versus 13.7 cells (n = 18) (p < 0.001). n = number of surviving clones examined at 48 hpf. |
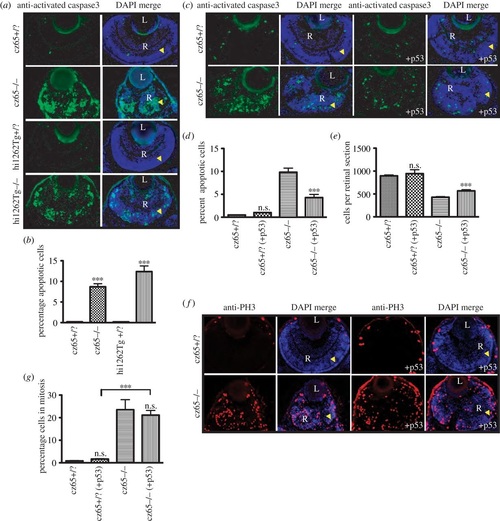
Apoptosis is associated with the MCPH phenotype. (a,b) High levels of apoptotic cell death occur within the retina of developing stil mutant embryos. (a) Little or no apoptotic cell death, as marked by antiactivated caspase-3 antibody (green) was seen in stilcz65+/? retinas at 72 hpf (also shown with DAPI-counterstain in blue). By contrast, high levels of apoptotic cell death were seen throughout the retina of stilcz65-/- embryos. A similar pattern was seen in stilhi1262Tg-/- embryos, with little apoptotic death in stilhi1262+/? retinas, but high levels of apoptosis in the stilhi1262Tg-/- mutant. (b). In stilhi1262Tg-/- mutants at 72 hpf, 8.7% of retinal cells were observed to be undergoing apoptosis (n = 52) versus 0.2% in stilcz65+/? (n = 24) (p < 0.001). In stilhi1262Tg-/- embryos, 12.4% of retinal cells were apoptotic (n = 16) versus 0.2% in stilhi1262+/? (n = 22) (p < 0.001). (c-g) Blocking apoptosis in stil mutant embryos partially rescued the retinal phenotype but did not rescue the mitotic phenotype. (c-d) anti-p53 Mo injection led to a reduction in apoptosis (green; antiactivated caspase-3) in stilcz65-/- mutants at 72 hpf, from 9.8% of cells (n = 39) to 4.3% (n = 15), p < 0.001. By comparison, 0.47% of retinal cells underwent apoptosis in stilcz65+/? embryos (n = 38) with no significant difference with anti-p53 Mo (1.0%; n = 2), p > 0.05. This anti-p53 Mo-related reduction in apoptosis led to partial rescue of retinal size (c,e), with an increase in mean cells per retinal section to 568 (n = 15) from 429 (n = 39), p < 0.01. A smaller, non-significant increase in retinal cells was seen in stilcz65+/? embryos; 944 (n = 2) versus 895 (n = 38), p > 0.05). (f) While anti-p53 Mo reduces apoptosis and led to an increase in retinal size and cell number, there was no significant effect on the mitotic phenotype, as demonstrated by anti-PH3 immunostaining (red). (g) anti-p53 Mo injection had no significant effect on MI (stilcz65-/- with p53 Mo; 21.2% (n = 12) versus 23.5% (n = 7) for stilcz65-/- without p53 Mo, p > 0.5. As a control, anti-p53 Mo was also injected into stilcz65+/? embryos with no significant effect on percentage of mitotic cells (stilcz65+/? with p53 Mo 1.7% (n = 13) versus 0.8% (n = 3) in stilcz65+/? embryos without p53 Mo; p < 0.05. n = number of eyes analysed. PHENOTYPE:
|
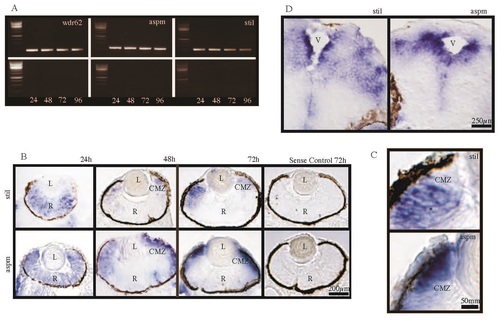
The MCPH genes stil, aspm and wdr62 are expressed in developing zebrafish embryos at early time points including 24hpf, 48hpf, 72hpf and 96hpf. In-situ hybridization (ISH) for stil and aspm demonstrated expression in the retina and brain, with localization to regions of active proliferation. (A) RT-PCR demonstrates expression of wdr62, aspm and stil at 24hpf, 48hpf, 72hpf and 96hpf alongside a 1kb DNA ladder. Bands correspond to predicted product sizes - 192bp (wdr62), 314bp (aspm) and 309bp (stil). Control PCR reactions (minus the RT step) are shown for each time point and condition, directly below each corresponding gel. (B) ISH of zebrafish retinal sections, using DIG-labelled antisense probes, demonstrates expression patterns of stil and aspm at 24hpf, 48hpf and 72hpf. Expression of stil is seen throughout the neural retina at 24hpf but by 48hpf expression occurs almost exclusively at the ciliary marginal zone (CMZ). Continued CMZ-specific expression of stil can be seen at 72hpf. Similarly, aspm is expressed throughout the neural retina at 24hpf. However, at 48hpf expression occurs mainly at the CMZ and in adjacent retinal tissue and by 72hpf strong aspm expression is seen in the CMZ, with weak to no staining elsewhere in the retina. Sense probe hybridization was performed as a control (shown here for each gene at 72hpf). (C) CMZ staining at 72hpf for both stil and aspm shown in high magnification. (D) ISH of zebrafish embryo brain sections at 72hpf demonstrates stil and aspm expression in the periventricular regions, where progenitor cells continue undergoing mitotic cell division. EXPRESSION / LABELING:
|