
|
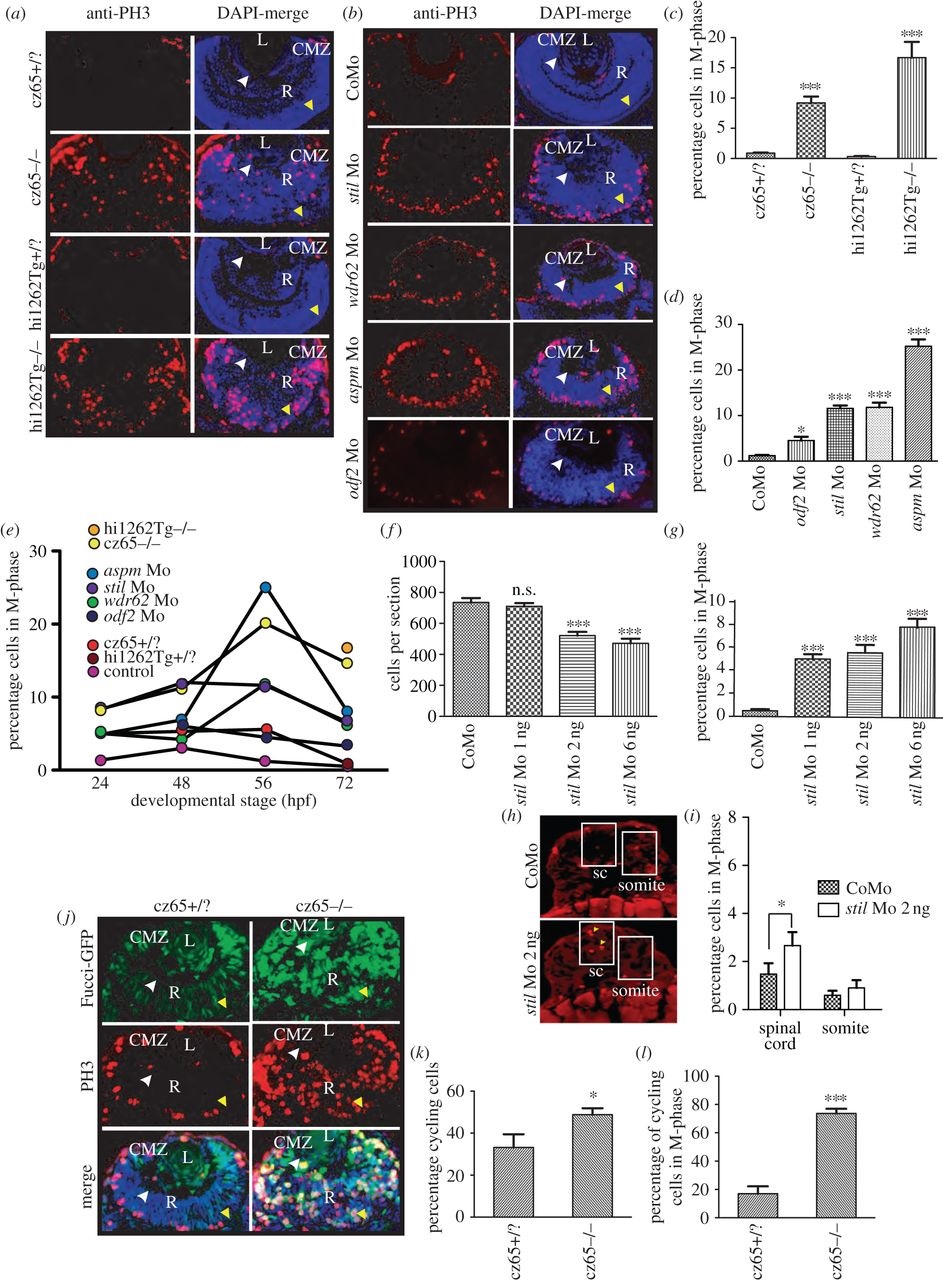
Fig. 3
Knockdown of stil, aspm, wdr62 or odf2 results in an increase in mitotic cells within the developing zebrafish retina. (a) PH3 staining (red) reveals a dramatic increase in mitotic cells within the retina of stilcz65-/- versus stilcz65+/? embryos at 72 hpf and in stilhi1262Tg-/- versus stilhi1262+/? embryos. Mitotic cells were also abnormally localized in mutant embryos, being scattered throughout the retina rather than limited to the CMZ. DAPI-counterstain (blue) demonstrates the smaller retinas in mutant embryos, with a disorganized appearance and delayed lamination. (b) PH3 staining (red) demonstrates increased mitotic cells within stil, wdr62, aspm and odf2 morphant retinas at 56 hpf. Note that mitotic cells are localized to the apical membrane in morphant retinas, rather than scattered throughout the retina, although they are not restricted to the CMZ as in control embryos. DAPI-counterstain (blue) also demonstrates reduced retinal size and delayed lamination. (c) The percentage of retinal cells in mitosis (mitotic index; MI) was significantly increased in stilcz65-/- versus stilcz65+/? retinas: 14.6% (n = 71) versus 0.9% (n = 56), p < 0.001. A similar increase was observed in stilhi1262Tg-/- versus stilhi1262+/? retinas: 16.7% (n = 32) versus 0.3% (n = 29), p < 0.001 (values are for MI at 72 hpf). (d) A significant increase in MI was also seen in morphant embryos (values reflect MI at 56 hpf): odf2 Mo (4.5%; n = 14) versus control Mo (1.2%; n = 61), p < 0.05; stil Mo (11.6%; n = 12), p < 0.001; wdr62 Mo (11.8%; n = 13), p < 0.001); and aspm Mo (25.2%; n = 25), p < 0.001. (e) An increase in the MI was observed at all examined time-points for all mutant and morphant conditions. Here, MI is plotted against developmental time-points (24, 48, 56 and 72 hpf) for each condition. Note the peak of MI around 56 hpf in most mutant and morphant conditions and the slightly earlier peak at 48 hpf in control embryos. (f) Reduced amounts of stil Mo led to a similar but less severe reduction in the number of cells per retinal section: stil Mo 6 ng (471 cells, n = 23), versus 735 p < 0.001; stil Mo 2 ng (521 cells, n = 17), versus 735 p < 0.001); stil Mo 1 ng (710 cells; n = 13) versus 735 cells in control embryos (n = 7), p > 0.05). (g) Reduced amounts of stil Mo also led to a corresponding reduction in the MI: stil Mo 6 ng 7.7% (n = 12), versus 0.5% p < 0.001; stil Mo 2 ng 5.5% (n = 17), versus 0.5% p < 0.001); stil Mo 1 ng 5.0% (n = 13) versus 0.5% in control embryos (n = 15), p < 0.001). (h) PH3 staining (yellow arrowheads) of spinal cord (sc) and somite tissue in control embryos and embryos injected with 2 ng anti-stil morpholino. (i) Comparison of the percentage of cells in M-phase in spinal cord and somites (n = 21 anti-stil morpholino versus n = 24 control morpholino embryos). (j) Fucci-GFP expression (green) in cycling cells, combined with anti-PH3 immunostaining (red) of fixed sections and DAPI-counterstain (blue) demonstrates an increase in the percentage of cells in stilcz65-/- retinas that are in the cell cycle at 32 hpf and a marked increase in the percentage of those cycling cells that are in mitosis. Note also the distribution of cycling cells is abnormal, with most cycling cells (green) localized in the CMZ in control embryos but throughout the retina in mutants. Furthermore, mitotic cells (red) are seen only at the apical membrane in control retinas but throughout the retina in mutants. (k) The percentage of retinal cells in the cell cycle (excluding G1) is increased in stilcz65-/- (49%; n = 14) versus stilcz65+/? embryos (33%; n = 5), p < 0.01). (l) The percentage of these cycling cells in mitosis was also dramatically increased in stilcz65-/- (74%; n = 14) versus stilcz65+/? embryos (17%; n = 5, p < 0.001). n = number of eyes analysed. Labels: L, lens; R, retina; CMZ, ciliary marginal zone; white arrowhead, basal membrane; yellow arrowhead, apical membrane.