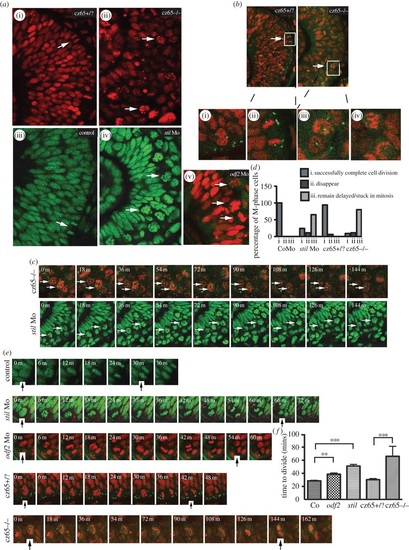
MCPH gene depletion causes a block or delay at prometaphase. Mitotic retinal cells in stil mutant embryos appear to be delayed in prometaphase. A similar but less severe phenotype occurs in stil morphants and odf2 morphants. (a) Views of the retina at approximately 30 hpf demonstrate (i) the normal appearance of retinal progenitor cells in stilcz65+/? embryos (H2B-RFP marks nuclei red) and (iii) control embryos (H2B-GFP marks nuclei green). White arrows mark dividing cells (anaphase) at the apical membrane. (ii) By contrast, in stilcz65-/- embryos the retina appears disorganized with markedly more cells in mitosis. The appearance of these cells (white arrows) suggests they are in prometaphase. A similar but less severe phenotype was observed in (iv) stil morphants and (v) odf2 morphants. In both morphant conditions, numerous ‘prometaphase’-like cells were observed in the retina (white arrows), although in contrast to mutants these cells were localized near to the apical membrane. (b) Centrosomal abnormalities are present in stilcz65-/- embryo retinas, including reduced centrosome expression and loss of apical centrosome positioning. Normal apical centrosomes are seen in stilcz65+/? embryos (green; centrin-GFP). (i) As cells round up and enter mitosis in stilcz65+/? embryos two centrosomes can be seen. (ii) A dividing cell is shown in a stilcz65+/? embryo, with a single centrosome at each pole of the newly forming daughter cells. By contrast, in stilcz65-/- embryos mitotic cells lack one or both centrosomes. (iii) Many prometaphase-like cells appear to be associated with only a single centrosome (white arrows, and at high magnification in (v) or (iv) no centrosome. (c) Many mitotic cells in stilcz65-/- mutants and stil morphants remain arrested in mitosis throughout live 2-3 h movies. Here frames demonstrate cells arrested in mitosis (white arrows) in stilcz65-/- embryos (nuclei in red; marked by H2B-RFP; centrosomes in green; marked by centrin-GFP) over a period of at least 144 min. Over the same period, stil morphant cells (green; marked by H2B-GFP) are also seen arrested in mitosis (white arrows). (d) Throughout movies a marked reduction in the percentage of cells successfully completing division was noted in stil mutants and morphants, with many cells remaining delayed or stuck in mitosis. In control embryos, 100% of cells entering mitosis during the first 2 h of a 3-h movie successfully completed cell division before the end of the 3-h movie (n = 29). A similar outcome was observed in stilcz65+/? control embryos; 94% of cells successfully completed cell division with 6% of cells disappearing from view (n = 17). In stil morphants, only 24% of cells successfully completed division, with 11% disappearing from view and 65% remaining arrested or delayed in M-phase for 60 min or longer (n = 37). In stilcz65-/- mutants, the phenotype was even more severe, with 11% of mitotic cells disappearing, 80% remaining stuck or delayed in M-phase and only 9% successfully completing mitotic division (n = 54). Three separate 180-min movies were analysed for each condition. n = total number of mitotic cells analysed for each condition. (e) Successful mitotic divisions were slower in morphants and mutants versus control. Typical divisions are shown for control, stil morphant, odf2 morphant, stilcz65+/? and stilcz65-/- embryos. Black vertical arrows indicate the beginning of M-phase (0 min), when the dividing cell rounds up at prophase, and the end of M-phase, when two daughter cells have been formed and chromatin decondensation has commenced. In these examples, mitosis took approximately 30 min (control), 66 min (stil Mo), 54 min (odf2 Mo), 42 min (stilcz65+/?) and a minimum of 144 min (stilcz65-/-) (note that for the stilcz65-/- mutant the dividing cell had already entered M-phase before the movie commenced so the true length of time to complete division was longer than this minimum estimate). (f) The time for morphant and mutant retinal cells to successfully complete mitotic division was increased. Three separate movies were analysed for each condition. The mean time to complete mitotic cell division was increased in stil morphants (n = 23) versus control (n = 29) (51 versus 29 min; p < 0.001) and odf2 morphants (n = 55) (38.7 versus 29 min; p < 0.01). The mean time to complete mitotic cell division was also markedly increased in stilcz65-/- embryos (n = 5) versus stilcz65+/? (n = 15) (at least 66 versus 30 min; p < 0.001). Overall, mitotic cell division within the retina was most severely prolonged in stilcz65-/- mutants and moderately prolonged in both stil morphants and odf2 morphants. n = number of successful mitotic divisions analysed.
|
