
- Title
-
Mmp17b is essential for proper neural crest cell migration in vivo
- Authors
- Leigh, N.R., Schupp, M.O., Li, K., Padmanabhan, V., Gastonguay, A., Wang, L., Chun, C.Z., Wilkinson, G.A., and Ramchandran, R.
- Source
- Full text @ PLoS One
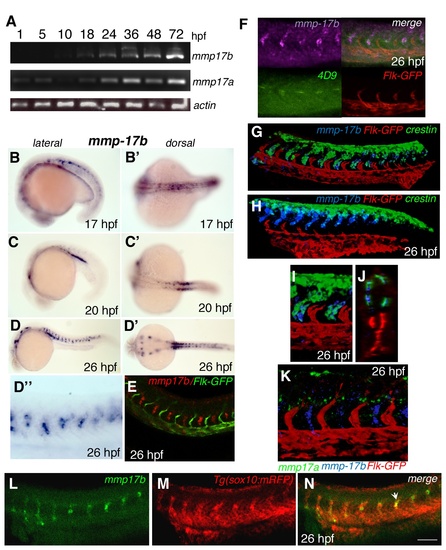
Spatial and temporal characterization of mmp17b expression. A is RT-PCR showing temporal expression of mmp17b and mmp17a compared to β-actin. Mmp17b expression commences at around 18 hpf while mmp17a is expressed as early as 5 hpf. B-E are whole mount in situ hybridization (WISH) panels of mmp17b at different embryonic stages (B and B′, 17 hpf; C and C′, 20 hpf; D and D′, 26 hpf). Earlier in development mmp17b is expressed more dorsally and then moves more posterior and ventral as development continues. Panel E shows mmp17b fluorescent in situ hybridization (FISH) in red and immunofluorescence (IF) for Flk-GFP in a 26 hpf embryo, which illustrates lack of mmp17b expression in the vasculature. Panels F, G-H, I-J and K are three color WISH staining performed as described in materials and methods with different probes as indicated in each panel. In panel F, mmp17b (purple), lower left is 4D9 staining (green) the muscle pioneer cells, lower right is Flk-GFP marking (red) the endothelial cells, and upper right is a merge. In this panel you can observe that 4D9 staining is located in the same region as mmp17b. G-H panel shows three color ISH image of 26 hpf zebrafish trunk and plexus with mmp17b (blue), Flk-GFP (red), and crestin (green). In the trunk image, crestin and mmp17b are overlapping in expression suggesting co-expression of these two genes in the same cell. The expression of both crestin and mmp17b are more dorsal in posterior regions of the embryo. Panels I-J represent high-powered image of the panel G. J is an optical section of panel G. Panel K is a three color image of 26 hpf zebrafish trunk with mmp17a (green), mmp17b (blue), and Flk-GFP (red). This image illustrates that mmp17a and mmp17b are expressed in different regions of the developing embryo. B-D are lateral views, B’-D’ are dorsal views. D” is a close-up of the panel D. Panels L-N are single plane confocal images of a 26 hpf embryo stained for mmp17b using FISH (panel L, green), and immunostaining for sox10 cells labelled with RFP (panel M, red). Panel N is the merged images showing co-localization of mmp17b and sox10 as indicated by yellow color (arrowhead). EXPRESSION / LABELING:
|
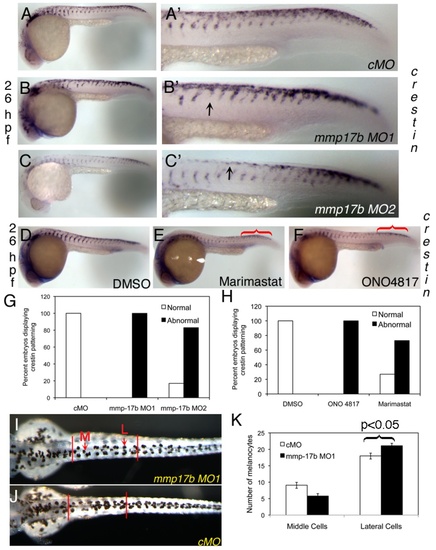
Mmp17b is involved in neural crest patterning. A-C and D-F are WISH staining for crestin in control MO (cMO) (A), MO1 (B), and MO2 (C) injected 26 hpf or DMSO (D), Marimastat (E) and ONO-4817 (F) treated 26 hpf embryos. A′-C′ are high powered images of the trunk regions of A-C. Arrowheads indicate crestin+ cells misplaced in the trunk. There is a mis-patterning of crestin in the trunk of the MO1 and MO2 injected embryos compared to control. There is also an accumulation of crestin+ cells in the posterior of the embryo (white bracket) compared to control. This is quantitated in panel G. N=25 for cMO; n=19 for MO1; n=18 for MO2. In panels D-F, WISH staining for crestin in MMP inhibitor treated 26 hpf embryos shows mis-patterning similar to mmp17b KD embryos (A-C). An accumulation of crestin+ cells in the posterior of the MMP inhibitor treated embryos is also observed (red brackets). This is quantitated in panel H. N=12 for DMSO; n=8 for ONO 4817; n=10 for Marimastat. I-K shows melanocyte quantitation done on 72 hpf fish. Dorsal images were taken of 72 hpf fish injected with either control MO (J) or mmp17b MO1 (I). The number of medial (M, red arrow) and lateral (L, red arrow) melanocytes is counted between the two vertical bars illustrated in panels I and J for 10 fish in each category. The results were quantitated in panel K. The medial cells were not statistically different but the lateral cells were at a p-value of less than 0.05. EXPRESSION / LABELING:
PHENOTYPE:
|
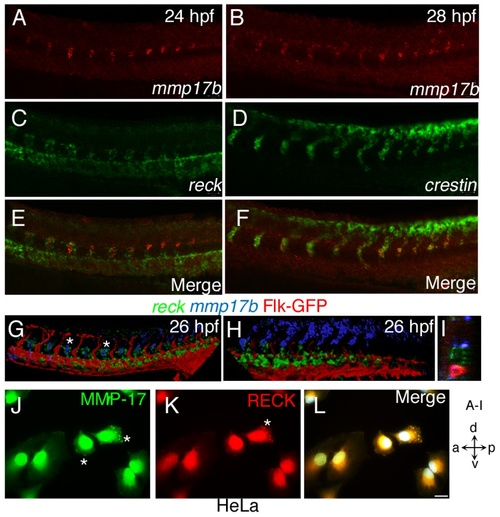
Mmp17b and Reck are involved in DRG formation. A, C and E are 26 hpf WISH embryos for mmp17b (A) in red and reck (C) in green. Panel E is a merge of the two images. Reck and mmp17b are expressed near each other in the trunk at this time point. B, D, and F are 26 hpf WISH embryos for mmp17b (B) in red and crestin (D) in green. Panel F is a merge of the two images. Mmp17b and crestin are co-expressed in the trunk at this time point. G, H, and I are confocal image of three color staining of mmp17b (blue), reck (green), and Flk-GFP (red) in the trunk (G) and plexus region (H) of 26 hpf embryos. Asterisks show that mmp17b and reck are expressed next to each other but not in the same cell. Optical section of panel G shown in panel I shows the proximity of mmp17b and reck expression. Panels J-L are cultured HeLa cells on glass coverslips double stained with MMP17 (J, Green) and RECK (K, Red) antibodies. The overlay of image (L) shows both MMP17 and RECK localizes within the cytoplasm in a punctate manner and near the leading edges of the cell indicated by asterisk (*). Image panel stained with DAPI not shown. Scale bar 10 micron. |
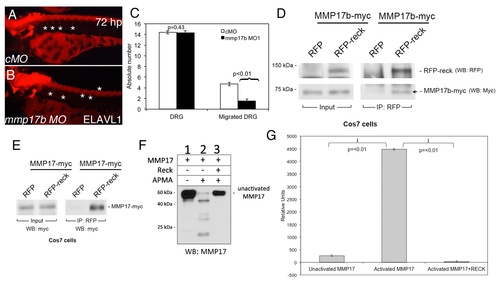
RECK blocks MMP17 activity in vitro. Elavl1 staining of control MO (cMO) (A) or mmp17b MO1 (B) injected 72 hpf embryos. Asterisks show the location of DRGs (dorsal root ganglia). Mmp17b knockdown embryos lack proper DRG development compared to controls. Quantitation of number of DRGs and migrated DRGs are indicated in panel C. Panel D is immunoprecipitation of myc-Mmp17b and RFP-Reck in Cos7 cells. Left panels indicate input of the two proteins in the sample, and right panels are RFP antibody immunoprecipitated samples followed by western blot. Arrow shows the pull down Mmp17b protein. Panel E is immunoprecipitation of myc-MMP17 and RFP-Reck in Cos7 cells. Left panel indicates input of MMP17 proteins in the lysate and the right panels indicate RFP antibody immunoprecipitated samples followed by western for myc epitope. Panel F is western blot of myc-MMP17 unactivated and activated with 4-aminophenylmercuric acetate (APMA) using MMP17 antibody. Activated MMP lanes show multiple bands, which are absent in samples co-incubated with RECK protein. Panel G is FRET-based fluorescence readout for MMP activity using the samples run on western blots in panel F. EXPRESSION / LABELING:
PHENOTYPE:
|
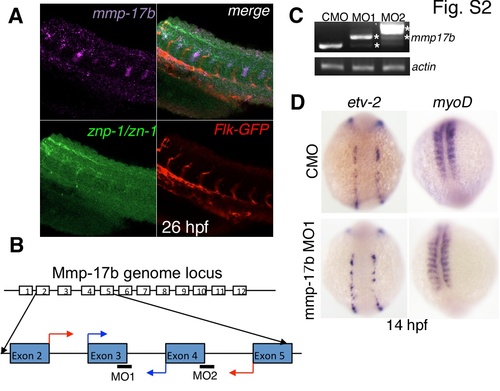
mmp17b expression, knockdown efficacy and role in early development. A shows three color staining of the trunk of a 26 hpf embryo for motor neurons. Upper left panel is mmp17b in purple, lower left panel is znp-1/zn-1 motor neuron staining in green, lower right panel is Flk-GFP staining endothelial cells in red, and the upper right panel is a merge. The upper right panel shows co-localization of mmp17b and znp-1/zn-1 staining. B shows cartoon illustrating where the mmp17b morpholinos (MO) were targeted. MO1 and MO2 targeted the exon-intron boundary of exons 3 and 4 respectively. Blue arrows indicate start of primers used to confirm efficacy of MO1. Red arrows indicate start of primers used to confirm efficacy of MO2. C shows efficacy for MO1 and MO2 demonstrated via RT-PCR. Primers illustrated in panel B were used to amplify mmp17b fragments. In both MO1 and MO2, the mmp17b amplicon was larger than the control MO injected sample. In MO1, there appeared to be a major higher band along with a minor band that was consistent with the normal mmp17b band. In MO2, there was a major band much higher than control and a minor band consistent with the higher band observed in the MO1 sample. Asterisks indicate the aberrant transcripts. β-actin was used as a loading control. D shows knockdown of mmp17b does not affect early development. When etv-2 (upper and lower left panels) and myoD (upper and lower right panels) are probed for in 14 hpf mmp17b MO1 injected embryos (lower left and right panels), there is no difference observed compared to control MO injected embryos (upper left and right panels). |
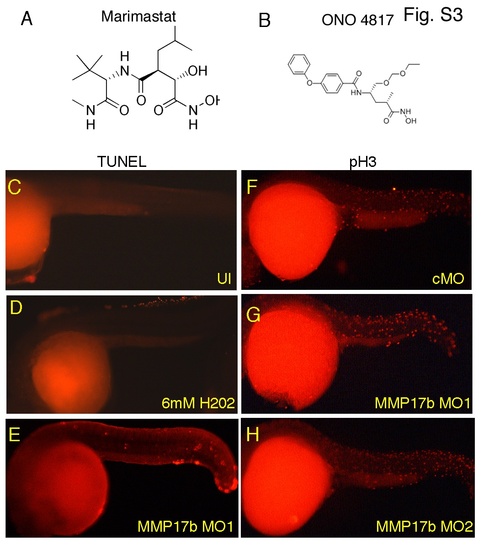
Proliferation and cell death in mmp17b knockdown embryos. A and B are structures of MMP inhibitors Marimastat and ONO-4817 used in this study. C-E are TUNEL assay staining performed on uninjected (UI) (C) and mmp17b MO1 (E) injected 26 hpf embryos. A 26 hpf control MO injected embryo treated with 6 mM H2O2 (D) was included as a positive control. F-H are phosphohistone H3 (pH3) staining performed on control MO (F), mmp17b MO1 G), and mmp17b MO2 (H) injected 26 hpf embryos. No difference was observed in mmp17b KD embryos compared to controls. |

Cartilage and vascular defects observed in mmp17b knockdown fish. A-B are bright field images of control MO (A) and mmp17b MO1-injected (B) 48 hpf embryos. Panel B illustrates the cupped-fin phenotype seen in mmp17b MO1-injected embryos compared to controls. This defect was quantitated in panel C that shows mmp17b MO1-injected embryos have a statistically significant increase in the cupped-fin defect compared to controls. Panels D and E show timp2a and timp2b 26 hpf ISH embryos (head is to the left). Yellow arrow in D shows plexus region and the black arrow indicates regions adjoining the vasculature. |