
- Title
-
Multi-organ Abnormalities and mTORC1 Activation in Zebrafish Model of Multiple Acyl-CoA Dehydrogenase Deficiency
- Authors
- Kim, S.H., Scott, S.A., Bennett, M.J., Carson, R.P., Fessel, J., Brown, H.A., and Ess, K.C.
- Source
- Full text @ PLoS Genet.
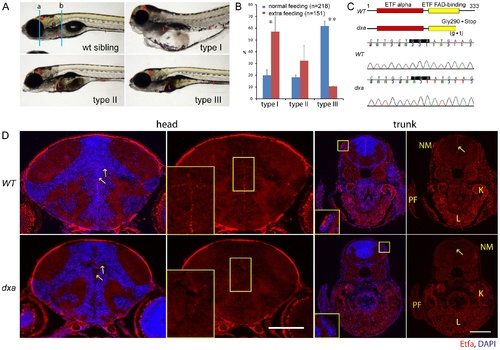
Classification of dxavu463 homozygous mutants, positional cloning of dxavu463 and Etfa protein expression. (A) Representative phenotypes of most severe (type I), moderate (type II) and mild (type III) dxa homozygous mutants at 7 dpf. Blue lines (a and b) indicate region of transverse sections in D. (B) Spectrum changes of type I, II and III mutants under different feeding conditions. Blue bars indicate the proportion of mutants under regular feeding (n = 218, 5 clutches), red bars for the proportion of mutants under extra feeding condition (n = 151, 3 clutches), p* = 0.03, p** = 0.00015. (C) Primary predicted structure of Etfa protein in wild-type and dxa zebrafish. Shaded codon indicates the null mutation of etfa in dxa zebrafish (GGA (Glycine) to TGA (stop)). (D) Anti-Etfa immunostaining (red) in wild-type control (upper panel, n = 9/9) and homozygous mutant (lower panel, n = 9/9) at 9 dpf. DAPI (blue) was used for nucleus staining. Arrows indicate Etfa expression in the ventricular region of the brain. Magnified midline views of yellow rectangles are in the left corners. Magnified rectangles on the trunk sections indicate neuromast hair cells. NM, neuromast; PF, pectoral fin; K, kidney; L, liver. Scale bar = 100 μm. |
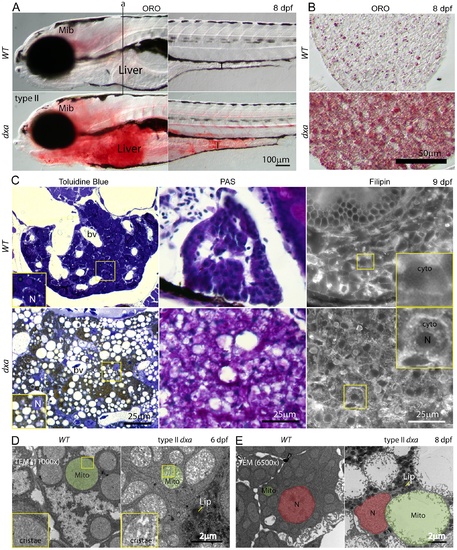
Lipids, cerebroside sulfate and free cholesterol accumulations in the cytosol of type II dxavu463 hepatocyte. (A) Whole mount Oil Red-O (ORO) staining of wild type and type II dxa at 8 dpf. Vertical line (a) indicates location of transverse section in B. (B) ORO staining in the liver sections at 8 dpf. (C) Toluidine blue, PAS and Filipin staining at 9 dpf. Wild type control livers are on the top row and dxa are on the bottom row. Magnified views of rectangles showing toluidine blue are in the lower left corners. The brown colored drops in Toluidine blue staining suggests cerebroside sulfate accumulation. Magnified views of rectangles showing Filipin (free cholesterol) staining are in the upper right corners. Filipin appears to accumulate in the cytosol of mutant hepatocytes. (D) TEM image at 6 dpf. Green shadows mark single representative mitochondria. Magnified views of rectangles showing cristae are on the left lower corners. (E) TEM image at 8 dpf. Nuclei are colored red and single representative mitochondria are again colored green. Dark granules in dxa mutants appear to represent lipid drops. Mib, midbrain; I, intestine; L, liver; bv, blood vessels; N, nucleus; cyto, cytosol; Mito, mitochondria; Lip, lipid drops. Scale bar = (A) 100 μm, (B) 50 μm, (C) 25 μm and (D, E) 2 μm. |
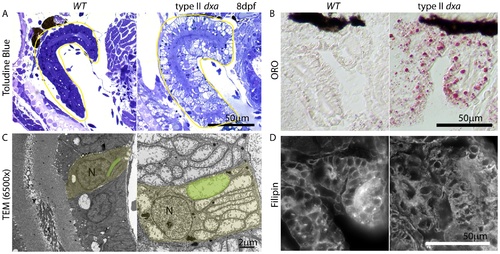
Kidney defects in 8 dpf dxavu463 mutant zebrafish. (A) Toluidine blue staining in pre-TEM sections at 8 dpf. Various sized vacuoles were observed in the dxa mutants. (B) ORO staining showing marked increase in lipids in dxa mutants. (C) TEM of kidney epithelium in wild type (left) and dxa mutants (right). Green colored regions indicate rod-shaped mitochondria in the kidney. (D) Filipin staining again shows free cholesterol accumulation in the cytosol of kidney cells. N, nuclei. Scale bar = 50 μm (A, B, D) and 2 μm (C). PHENOTYPE:
|
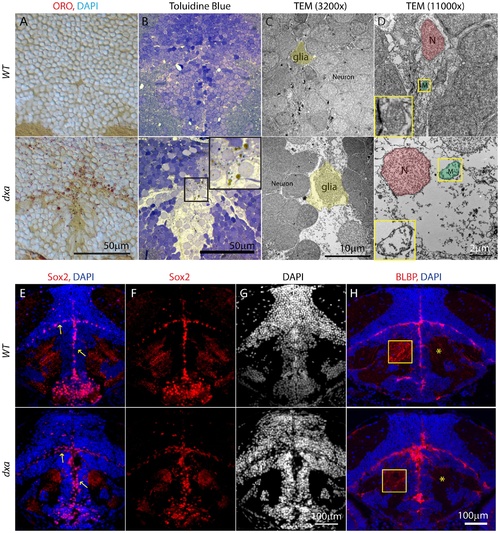
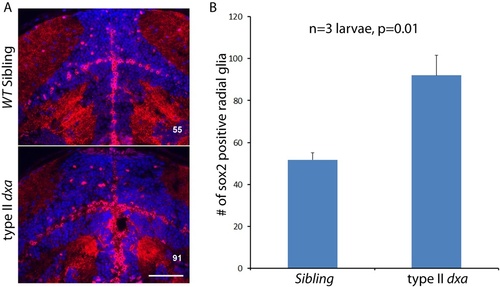
Lipid accumulation and necrotic features in the dxavu463 mutants with increased numbers of neural progenitor cells and dysmorphic brain. Top panels show control wild type zebrafish with bottom panels showing images from type II dxa mutant at 8 dpf. (A) ORO (red) showing increased lipids in the mutant brain, DAPI (bright blue) staining nuclei. (B) Toluidine blue staining in wild type and type II dxa with severe brain defects. Magnified view of midline region in the rectangle is shown on the upper right corner with greatly enlarged neural progenitor cells and neurons. Brown colored vesicles again suggest lipid drops containing cerebroside sulfate. (C) TEM image of VZ in WT (top) and type II dxa (bottom). Yellow pseudocolor indicates a single glia cell in WT and dxa mutants, marked increase in cell size is present. (D) Higher magnification image of neural progenitor cells. Green pseudocolor region indicates individual mitochondria. Pseudocolor with red indicates nuclei. Magnified views of normal and mutant mitochondria are shown on the left lower bottom. (E) Anti-Sox2 (red) and DAPI (blue) staining in control (top) and dxa zebrafish (bottom). Yellow arrows indicate Sox2 positive cells in the VZ. (F) Red channel image of (E). (G) DAPI channel of (E) showing disrupted gray matter of brain. (H) Anti-BLBP staining in wild type (top) and dxa (bottom). Asterisks indicate white matter region normally containing glia fibers. Region within the yellow box is further magnified to allow fine details of glial fibers to be seen. Contrast levels of control (top) and dxa zebrafish (bottom) were adjusted together to compare glial fibers. Scale bar = 50 μm (A, B), 10 μm (C), 2 μm (D) and 100 μm (E–H). PHENOTYPE:
|
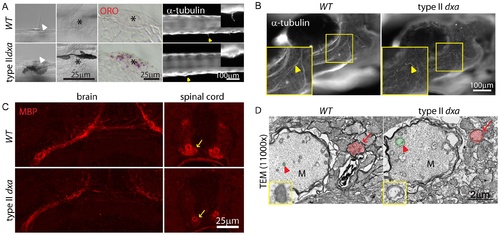
Facial axons, mechanosensory hair cell and myelination defects in type II dxavu463 mutant zebrafish. (A) DIC imaging of live cilia (first column) and neuromast cells (second column, asterisks), ORO stained lipids in neuromast cells (third column, asterisks). Acetylated-tubulin marks cilia (yellow arrowheads). Magnified views of cilia are shown on the upper right corner. (B) Whole mount immunofluorescence staining of acetylated-tubulin in WT (left) and dxa mutants (right) at 8 dpf. Yellow arrowheads indicate facial axons. Rectangle region is magnified in lower left corner. (C) anti-MBP staining in the brain (left) and spinal cord (right) in WT (top) and dxa mutant zebrafish (bottom) at 8 dpf. Arrows indicate myelinated axons in the spinal cord, all signal is reduced in dxa mutant zebrafish. (D) TEM (11,000×) image of spinal cord as indicted by arrows in C. Normal (WT) and swollen (dxa mutant) mitochondria are pseudocolored green, indicated by large red arrowhead). Red arrows indicate less condensed myelination layer in a dxa axon. Further magnified views of mitochondria are on the lower left corner. M, Mauthner axon track. Scale bars are as indicated in each panel. PHENOTYPE:
|
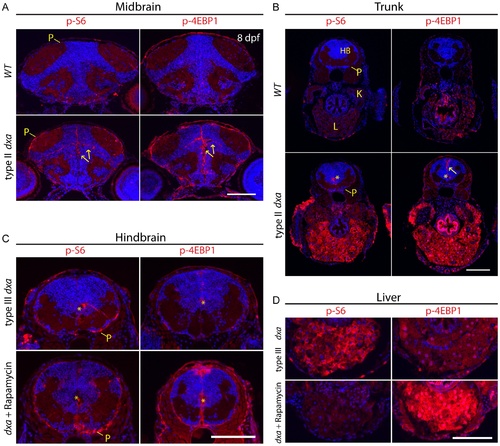
Tissue dependent regulation of mTORC1 activation in dxavu463 mutant zebrafish. Anti-phospho-S6 (left panels) and anti-phospho-4E-BP1 (right panels) antibodies were used to assess mTORC1 kinase activity. (A) WT brain (top) and dxa brain (bottom) at 8 dpf. Arrows indicate p-S6 and phospho-4E-BP1 positive cells in neural progenitors of the brain. P-S6 and p-4E-BP1 are also detected in the superficial pial cells of the mutant brain. (B) Sections of trunk regions in WT (top) and dxa (bottom) at 8 dpf. Phospho-S6 was detected in the central canal and phospho-4E-BP1 positive cells were found central canal as well as midline cells (yellow arrow) in dxa mutant zebrafish. Asterisks indicates central canal of hindbrain. 300 nM of rapamycin was used from 5 dpf to 8 dpf to treat dxa mutant zebrafish in C and D. (C) Hindbrain regions of type III mutant at 8 dpf. Phospho-S6 and phospho-4E-BP1 staining was again detected in central canal (*) and pial cell sheath (P) in both control and rapamycin treated dxa mutants. DAPI (blue) was used for nuclei staining. (D) Liver regions of same sections seen in (C) with marked suppression of phospho-S6 but a relative increase in phsohp-4E-BP1 levels. P, pial cell sheath; HB, hindbrain; K, kidney; L, liver. Scale bar = 100 μm. EXPRESSION / LABELING:
|
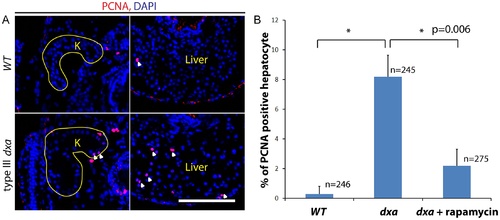
Increased proliferation in dxavu463 mutant kidney and liver. (A) PCNA staining in the kidney and liver of wild type (top) and type III dxa mutant (bottom). Yellow lines indicate kidneys. DAPI (blue) was used for nuclei staining. (B) PCNA positive cells were counted from three different WT, dxa mutant and rapamycin treated dxa mutant liver section. N = 246 (WT), 245 (dxa), 275 (dxa + rapamycin) cells. *p = 0.006 for both comparisons. PHENOTYPE:
|
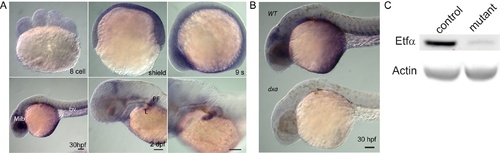
Whole-mount in situ hybridization of etfa during development. (A) Expression of etfa during early development. (B) Comparison of etfa expression in wild type and homozygous dxa mutant at 30 hours post fertilization. Mib, midbrain; bv, blood vessel; PF, pectoral fin; L, liver. Scale bar = 100 μm. (C) No expression of Etfa protein in WT and dxa mutant zebrafish at 6 dpf. |
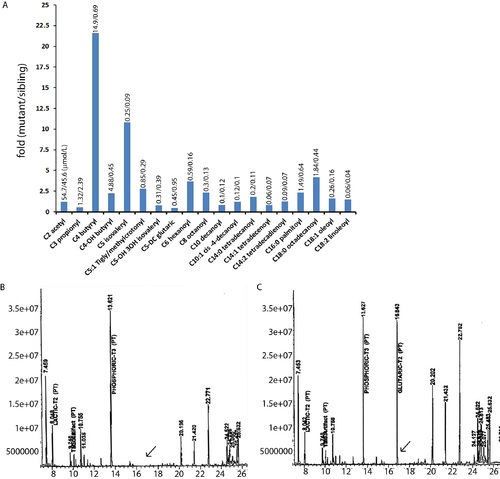
Abnormal acylcarnitine and organic acids in dxavu463 mutant zebrafish. (A) Representative profile from homogenized control siblings and homozygous dxa mutant larvae (9 dpf) using tandem mass spectrometry. The amount of species (µmol) is shown on the top of bars. (B) Organic acid profile from control siblings and (C) dxa mutant (9 dpf) using gas chromatography electron impact mass spectrometric analysis. Arrows indicate glutaric acid. N = 40 for both control siblings and homozygous mutant dxa zebrafish. PHENOTYPE:
|
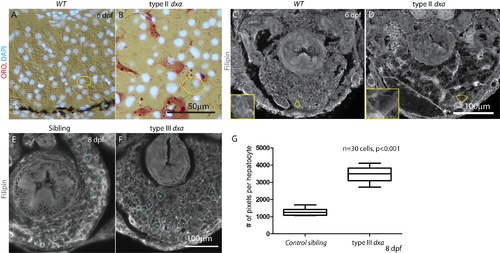
Liver defects and increased size of hepatocytes in dxavu463 mutant zebrafish. (A,B) ORO and DAPI staining of wild type (A) and dxa mutant liver at 6 dpf (B). (C,D) Filipin staining of wild type (C) and dxa liver at 6 dpf (D). Each of single cells are outlined with yellow in A–D, magnified views in lower left corner (C–D) shows absence of cholesterol accumulation in the cytosol of dxa. (E,F) Filipin staining of sibling control (E) and type III dxa (F) for cell size measurement at 8 dpf. Representative cells used for analysis are outlined in blue. (G) Total pixel numbers were measured to compare relative cell size in selected areas in E and F. Thirty cells (10 cells/larvae) were measured and control and mutant size were compared, p<0.001. Scale bar = 50 μm (A,B) and 100 μm (C–F). PHENOTYPE:
|
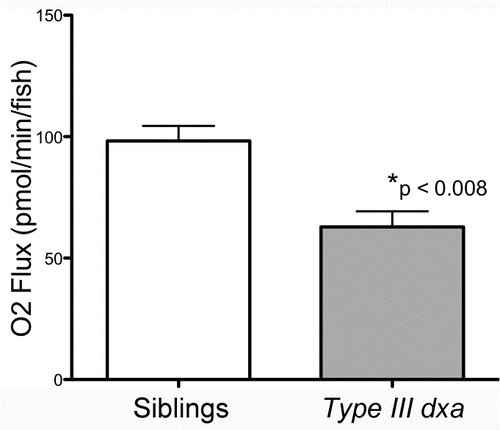
Decreased oxygen flux in type III dxavu463 at 8 dpf. Oxygen flux was measured by comparing oxygen consumption over time in control siblings and homozygous dxavu463 mutants. After the measured O2 concentration in the Oroboros O2k Oxygraph was stabilized, chambers were stirred at 100 rpm to allow recording of a new stable O2 concentration. Stirrers were then turned off as constant stirring was deleterious to the zebrafish larvae. This process was repeated until no further decrement in O2 concentration was measured and the fish were no longer motile. Average oxygen flux was then calculated from the change in O2 concentration over time from the beginning of the experiment to the end. p<0.007, Each experiment was repeated 4 times using 10 larvae of each genotype for each measurement. PHENOTYPE:
|
Liver defects and increased size of hepatocytes in dxavu463 mutant zebrafish. (A,B) ORO and DAPI staining of wild type (A) and dxa mutant liver at 6 dpf (B). (C,D) Filipin staining of wild type (C) and dxa liver at 6 dpf (D). Each of single cells are outlined with yellow in A–D, magnified views in lower left corner (C–D) shows absence of cholesterol accumulation in the cytosol of dxa. (E,F) Filipin staining of sibling control (E) and type III dxa (F) for cell size measurement at 8 dpf. Representative cells used for analysis are outlined in blue. (G) Total pixel numbers were measured to compare relative cell size in selected areas in E and F. Thirty cells (10 cells/larvae) were measured and control and mutant size were compared, p<0.001. Scale bar = 50 &mulm (A,B) and 100 μm (C–F). |

Lipid analysis in dxavu463 at 8 dpf. (A) Total monoacylglycerol (MAG), diacylglycerol (DAG) and triacylglycerol (TAG) level were compared with MAG decreases and TAG increases being statistically significant, *p<0.01, **p<0.001, n = 3. (B) Total phosphatidylcholine (PC) levels were unchanged with a slight statistically significant increase in phosphatidylethanolamine (PE), p = 0.043 and a marked statistically significant decrease in phosphatidylserine (PS) p<0.001, n = 3. PHENOTYPE:
|
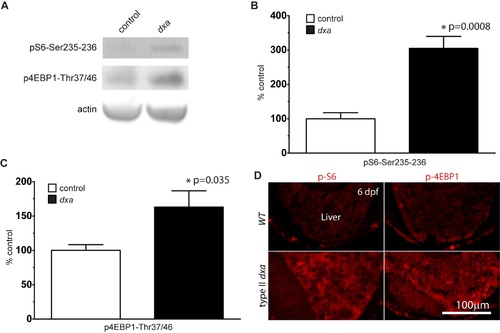
mTORC1 activation in dxavu463 at 6 dpf. (A) Immunoblot blots for phospho-S6Ser235/236 and phosphor-4E-BP1Thr37/46 in control sibling and dxa mutant zebrafish at 6 dpf. (B) Relative ratio of phospho-S6 amount in control and dxa mutants, p = 0.0003. (C) Relative ratio of phosphor-4E-BP1 amount in control and dxa mutants. P = 0.035, n = 5 samples per genotype, each samples contained 2 larvae. p = 0.0246. (D) Phospho-S6 (left panel) and phospho-4E-BP1 staining (right panel) in the liver of WT (top) and type II dxa (bottom) zebrafish at 6 dpf. Scale bar = 100 μm. |