
Fig. 2
- ID
- ZDB-FIG-130910-21
- Publication
- Kim et al., 2013 - Multi-organ Abnormalities and mTORC1 Activation in Zebrafish Model of Multiple Acyl-CoA Dehydrogenase Deficiency
- Other Figures
- All Figure Page
- Back to All Figure Page
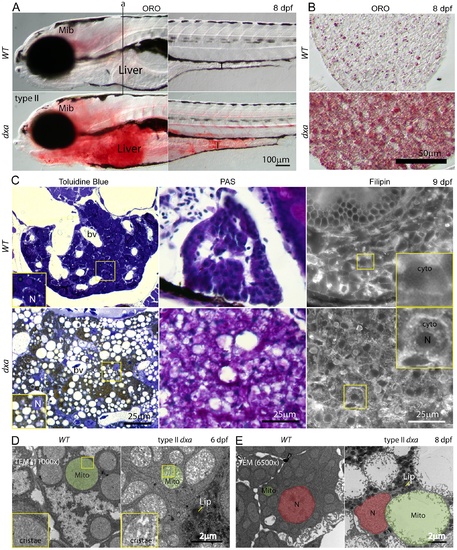
Lipids, cerebroside sulfate and free cholesterol accumulations in the cytosol of type II dxavu463 hepatocyte. (A) Whole mount Oil Red-O (ORO) staining of wild type and type II dxa at 8 dpf. Vertical line (a) indicates location of transverse section in B. (B) ORO staining in the liver sections at 8 dpf. (C) Toluidine blue, PAS and Filipin staining at 9 dpf. Wild type control livers are on the top row and dxa are on the bottom row. Magnified views of rectangles showing toluidine blue are in the lower left corners. The brown colored drops in Toluidine blue staining suggests cerebroside sulfate accumulation. Magnified views of rectangles showing Filipin (free cholesterol) staining are in the upper right corners. Filipin appears to accumulate in the cytosol of mutant hepatocytes. (D) TEM image at 6 dpf. Green shadows mark single representative mitochondria. Magnified views of rectangles showing cristae are on the left lower corners. (E) TEM image at 8 dpf. Nuclei are colored red and single representative mitochondria are again colored green. Dark granules in dxa mutants appear to represent lipid drops. Mib, midbrain; I, intestine; L, liver; bv, blood vessels; N, nucleus; cyto, cytosol; Mito, mitochondria; Lip, lipid drops. Scale bar = (A) 100 μm, (B) 50 μm, (C) 25 μm and (D, E) 2 μm. |
| Fish: | |
|---|---|
| Observed In: | |
| Stage Range: | Day 6 to Days 7-13 |